
Using GCC with MinGW
In this tutorial, you configure Visual Studio Code to use the GCC C++ compiler (g++) and GDB debugger from mingw-w64 to create programs that run on Windows. After configuring VS Code, you will compile, run, and debug a simple Hello World program.
This tutorial does not teach you about GCC, GDB, minGW-w64, or the C++ language. For those subjects, there are many good resources available on the Web.
If you have any problems, feel free to file an issue for this tutorial in the VS Code documentation repository.
Prerequisites
To successfully complete this tutorial, you must do the following steps:
- Install Visual Studio Code.
- Install the C/C++ extension for VS Code. You can install the C/C++ extension by searching for ‘C++’ in the Extensions view ( ⇧⌘X (Windows, Linux Ctrl+Shift+X ) ).
Installing the MinGW-w64 toolchain
Get the latest version of MinGW-w64 via MSYS2, which provides up-to-date native builds of GCC, MinGW-w64, and other helpful C++ tools and libraries. This will provide you with the necessary tools to compile your code, debug it, and configure it to work with IntelliSense.
- You can download the latest installer from the MSYS2 page or use this direct link to the installer.
- Run the installer and follow the steps of the installation wizard. Note that MSYS2 requires 64 bit Windows 8.1 or newer.
- In the wizard, choose your desired Installation Folder. Record this directory for later. In most cases, the recommended directory is acceptable. The same applies when you get to setting the start menu shortcuts step. When complete, ensure the Run MSYS2 now box is checked and select Finish. This will open a MSYS2 terminal window for you.
- In this terminal, install the MinGW-w64 toolchain by running the following command:
pacman -S --needed base-devel mingw-w64-ucrt-x86_64-toolchain 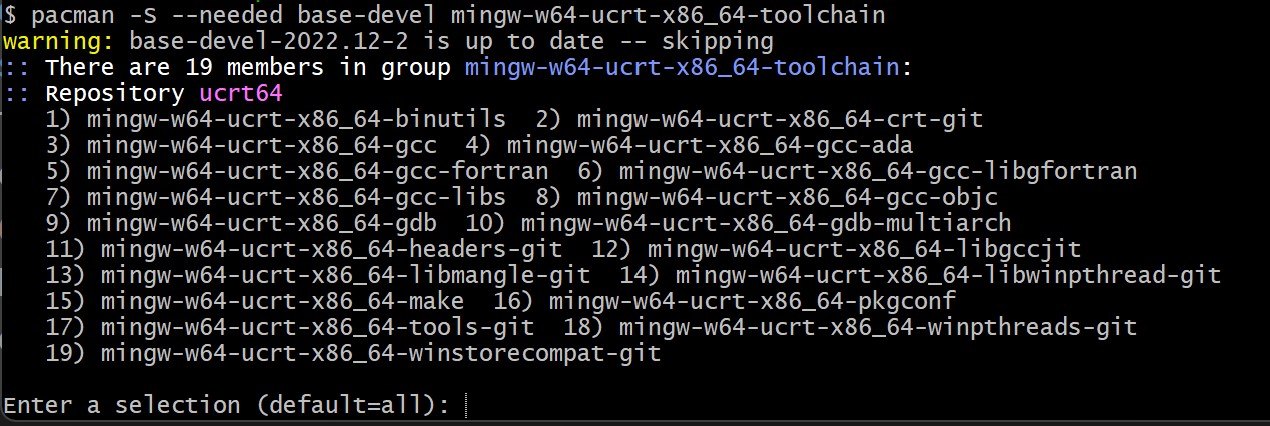
- In the Windows search bar, type Settings to open your Windows Settings.
- Search for Edit environment variables for your account.
- In your User variables, select the Path variable and then select Edit.
- Select New and add the MinGW-w64 destination folder you recorded during the installation process to the list. If you used the default settings above, then this will be the path: C:\msys64\ucrt64\bin .
- Select OK to save the updated PATH. You will need to reopen any console windows for the new PATH location to be available.
Check your MinGW installation
To check that your MinGW-w64 tools are correctly installed and available, open a new Command Prompt and type:
gcc --version g++ --version gdb --version You should see output that states which versions of GCC, g++ and GDB you have installed. If this is not the case:
- Make sure your PATH variable entry matches the MinGW-w64 binary location where the toolchain was installed. If the compilers do not exist at that PATH entry, make sure you followed the previous instructions.
- If gcc has the correct output but not gdb , then you need to install the packages you are missing from the MinGW-w64 toolset.
- If on compilation you are getting the «The value of miDebuggerPath is invalid.» message, one cause can be you are missing the mingw-w64-gdb package.
Create a Hello World app
First, lets get a project set up.
- Launch a Windows command prompt (Enter Windows command prompt in the Windows search bar), then
- Run the following commands. These will create an empty folder called projects where you can place all your VS Code projects. There, the next commands will create and navigate to a sub-folder called helloworld . From there, you will open helloworld directly in VS Code.
mkdir projects cd projects mkdir helloworld cd helloworld code . The «code .» command opens VS Code in the current working folder, which becomes your «workspace». Accept the Workspace Trust dialog by selecting Yes, I trust the authors since this is a folder you created.
As you go through the tutorial, you will see three files created in a .vscode folder in the workspace:
- tasks.json (build instructions)
- launch.json (debugger settings)
- c_cpp_properties.json (compiler path and IntelliSense settings)
Add a source code file
In the File Explorer title bar, select the New File button and name the file helloworld.cpp .

Add hello world source code
Now paste in this source code:
#include #include #include using namespace std; int main() vector msg "Hello", "C++", "World", "from", "VS Code", "and the C++ extension!">; for (const string& word : msg) cout << word < " "; > cout > Now press ⌘S (Windows, Linux Ctrl+S ) to save the file. Notice how the file you just added appears in the File Explorer view ( ⇧⌘E (Windows, Linux Ctrl+Shift+E ) ) in the side bar of VS Code:
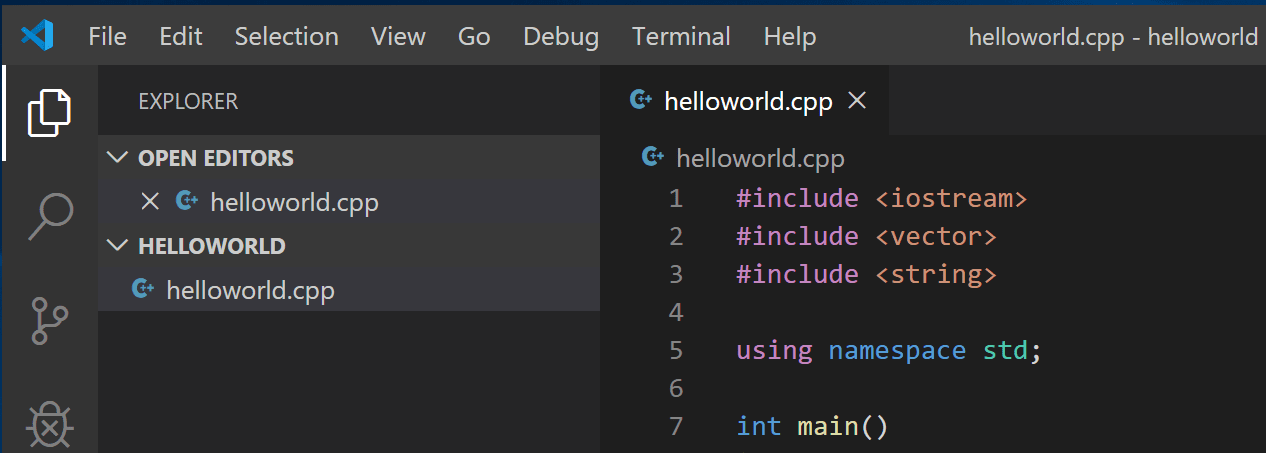
You can also enable Auto Save to automatically save your file changes, by selecting File > Auto Save. You can find out more about the other views in the VS Code User Interface documentation.
Note: When you save or open a C++ file, you may see a notification from the C/C++ extension about the availability of an Insiders version, which lets you test new features and fixes. You can ignore this notification by selecting the X (Clear Notification).
Explore IntelliSense
IntelliSense is a tool to help you code faster and more efficiently by adding code editing features such as code completion, parameter info, quick info, and member lists.
To see IntelliSense in action, hover over vector or string to see their type information. If you type msg. in line 10, you can see a completion list of recommended member functions to call, all generated by IntelliSense:
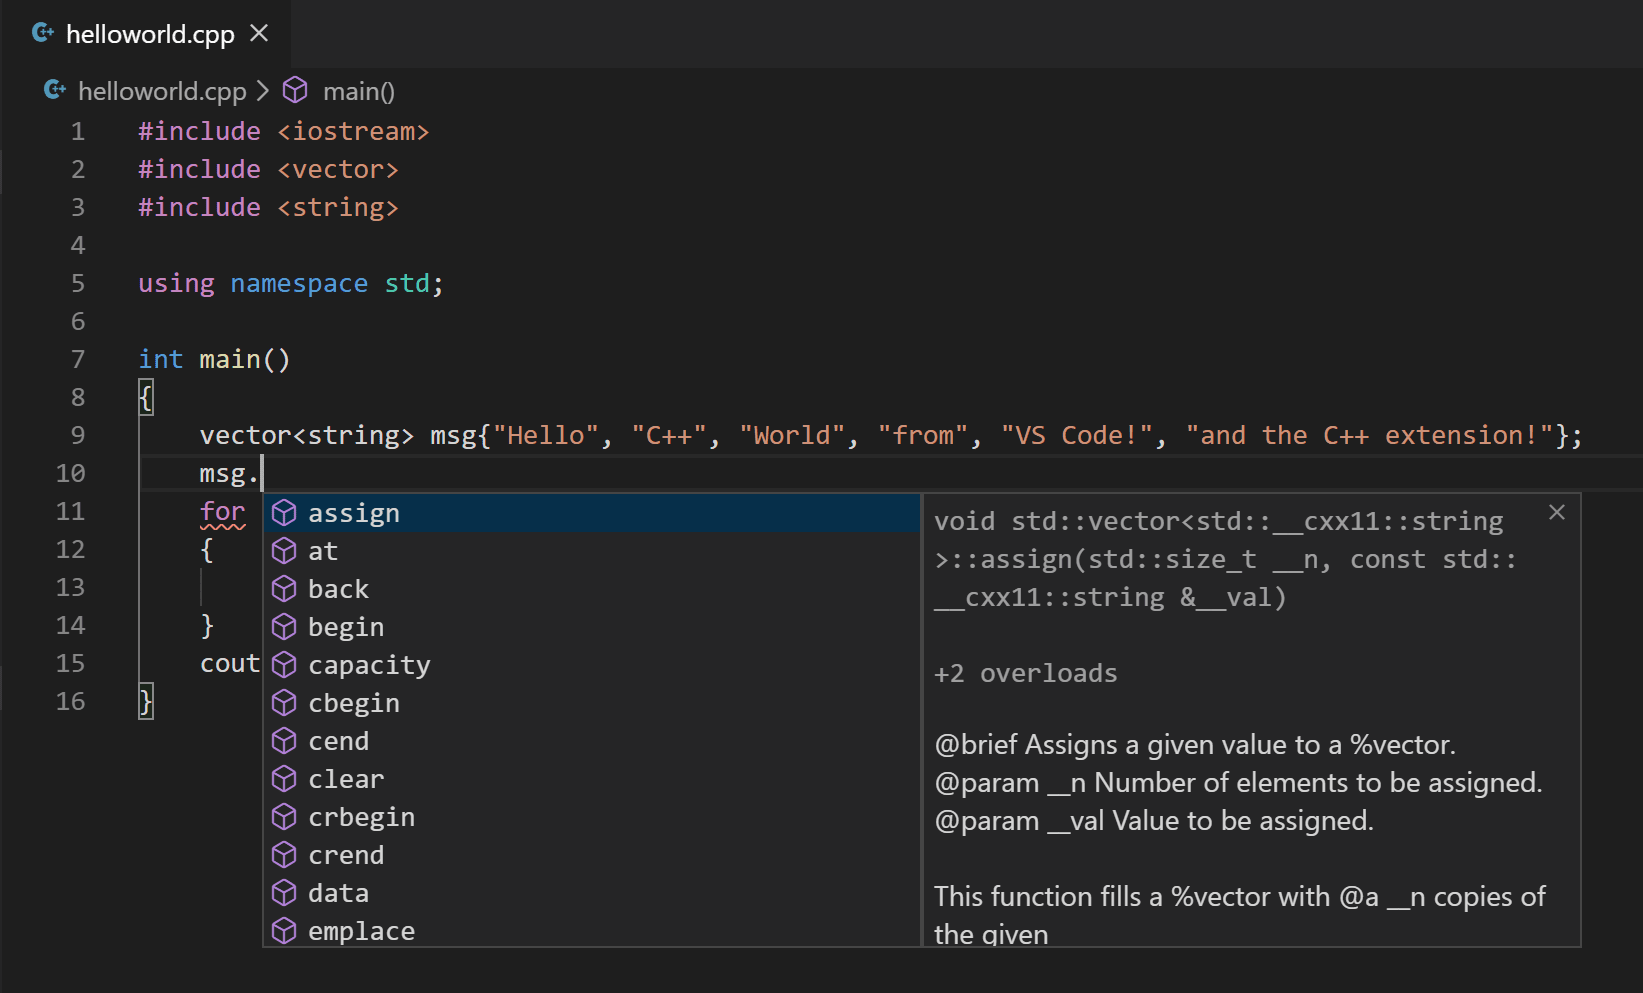
You can press the Tab key to insert a selected member. If you then add open parenthesis, IntelliSense will show information on which arguments are required.
If IntelliSense is not already configured, open the Command Palette ( ⇧⌘P (Windows, Linux Ctrl+Shift+P ) ) and enter Select IntelliSense Configuration. From the dropdown of compilers, select Use gcc.exe to configure.
Run helloworld.cpp
Remember, the C++ extension uses the C++ compiler you have installed on your machine to build your program. Make sure you have completed the «Installing the MinGW-w64 toolchain» step before attempting to run and debug helloworld.cpp in VS Code.
- Open helloworld.cpp so that it is the active file.
- Press the play button in the top right corner of the editor.
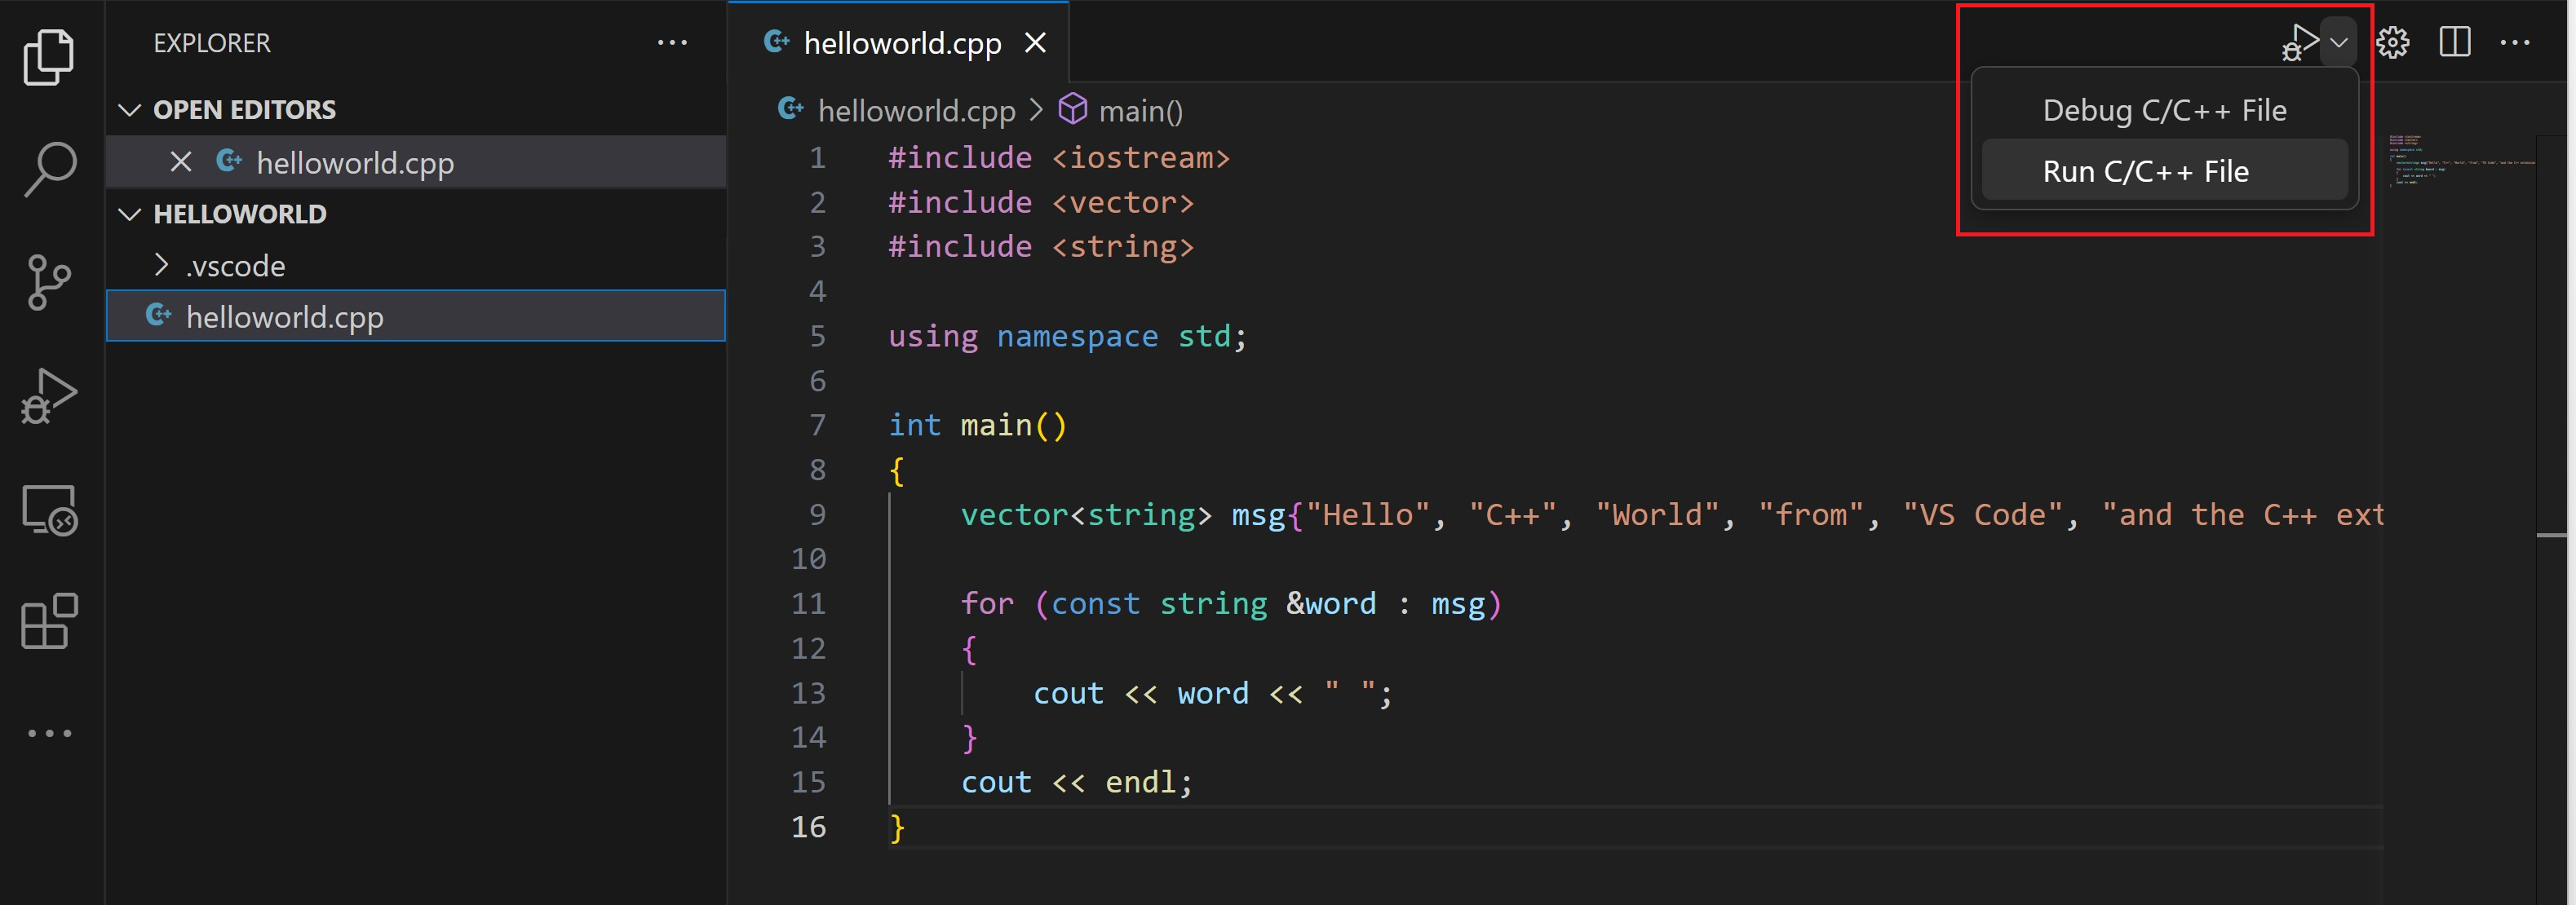
- Choose C/C++: g++.exe build and debug active file from the list of detected compilers on your system.
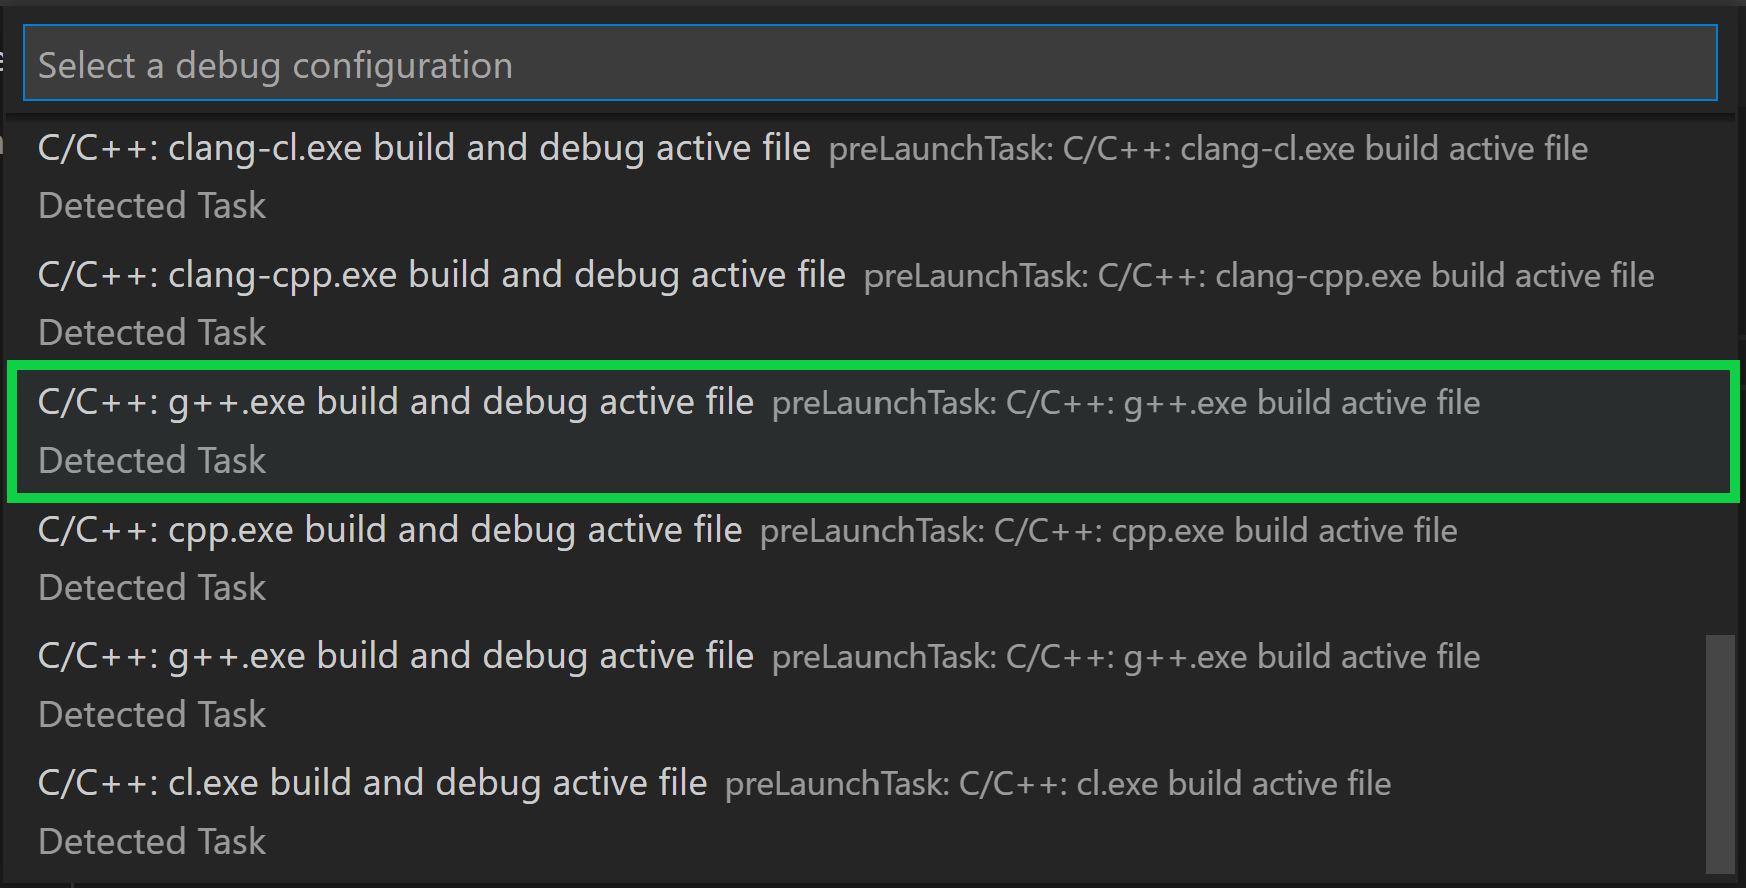
You’ll only be asked to choose a compiler the first time you run helloworld.cpp . This compiler will be set as the «default» compiler in tasks.json file.

- After the build succeeds, your program’s output will appear in the integrated Terminal.
Congratulations! You’ve just run your first C++ program in VS Code!
Understanding tasks.json
The first time you run your program, the C++ extension creates a tasks.json file, which you’ll find in your project’s .vscode folder. tasks.json stores your build configurations.
Your new tasks.json file should look similar to the JSON below:
"tasks": [ "type": "cppbuild", "label": "C/C++: g++.exe build active file", "command": "C:\\msys64\\ucrt64\\bin\\g++.exe", "args": [ "-fdiagnostics-color=always", "-g", "$", "-o", "$ \\$.exe" ], "options": "cwd": "$" >, "problemMatcher": ["$gcc"], "group": "kind": "build", "isDefault": true >, "detail": "Task generated by Debugger." > ], "version": "2.0.0" > Note: You can learn more about tasks.json variables in the variables reference.
The command setting specifies the program to run; in this case that is g++. The args array specifies the command-line arguments that will be passed to g++. These arguments are listed in this file in the specific order expected by the compiler.
This task tells g++ to take the active file ( $ ), compile it, and create an executable file in the current directory ( $ ) with the same name as the active file but with the .exe extension ( $.exe ). For us, this results in helloworld.exe .
The label value is what you will see in the tasks list; you can name this whatever you like.
The detail value is what you will as the description of the task in the tasks list. It’s highly recommended to rename this value to differentiate it from similar tasks.
From now on, the play button will read from tasks.json to figure out how to build and run your program. You can define multiple build tasks in tasks.json , and whichever task is marked as the default will be used by the play button. In case you need to change the default compiler, you can run Tasks: Configure Default Build Task in the Command Palette. Alternatively you can modify the tasks.json file and remove the default by replacing this segment:
"group": "kind": "build", "isDefault": true >, "group": "build", Modifying tasks.json
You can modify your tasks.json to build multiple C++ files by using an argument like «$/*.cpp» instead of $ .This will build all .cpp files in your current folder. You can also modify the output filename by replacing «$\\$.exe» with a hard-coded filename (for example «$\\myProgram.exe» ).
Debug helloworld.cpp
To debug your code,
- Go back to helloworld.cpp so that it is the active file.
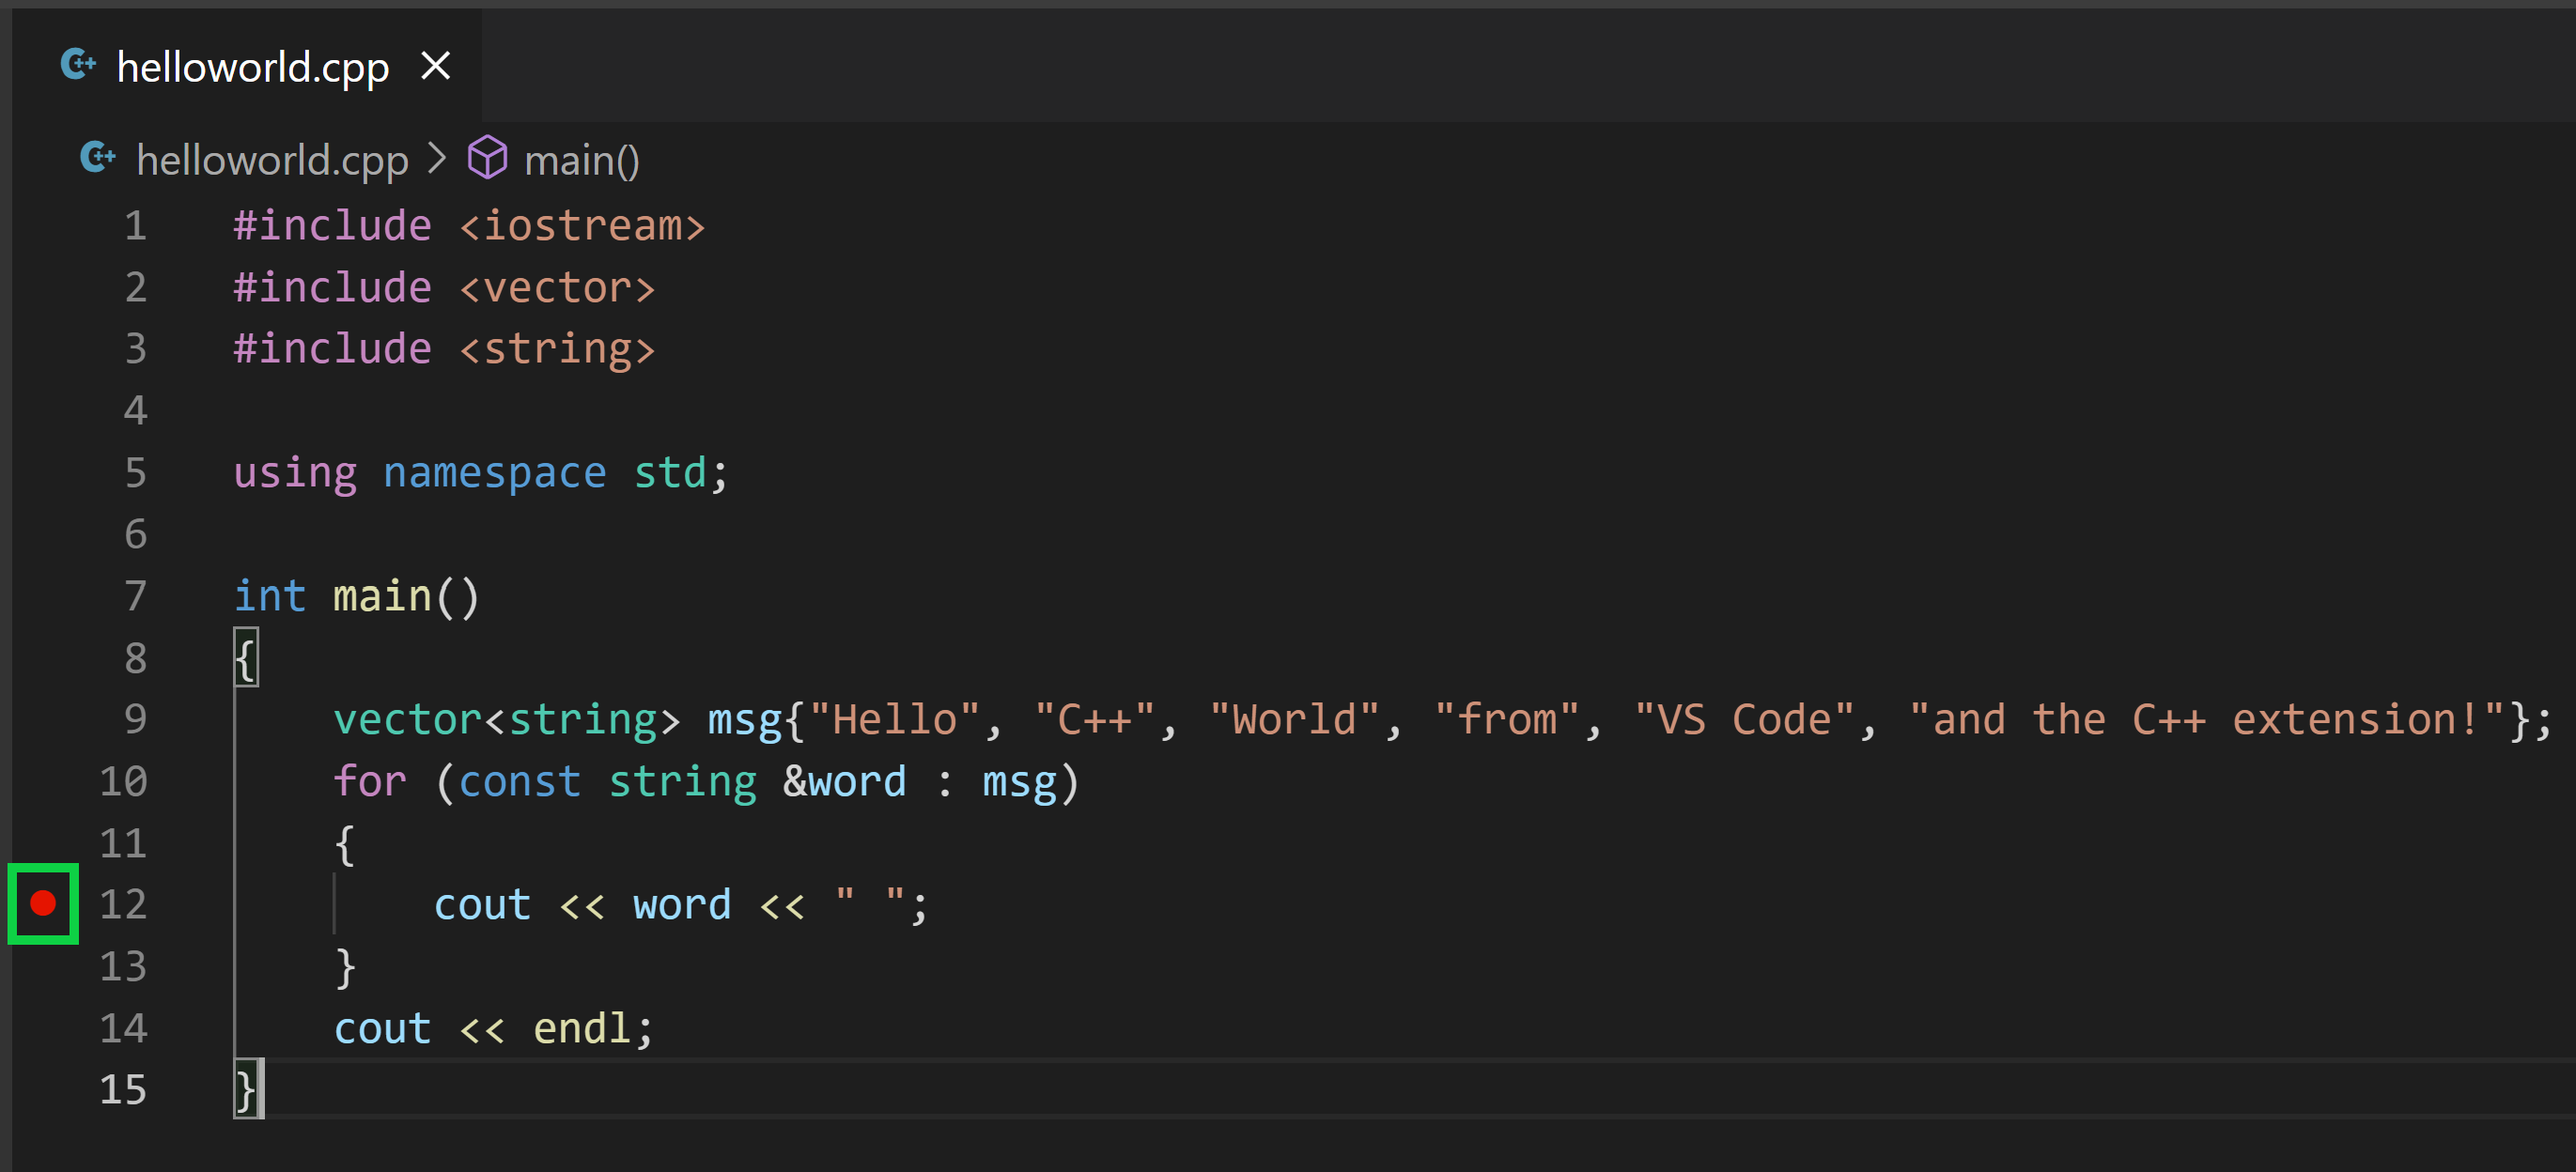
- Set a breakpoint by clicking on the editor margin or using F9 on the current line.
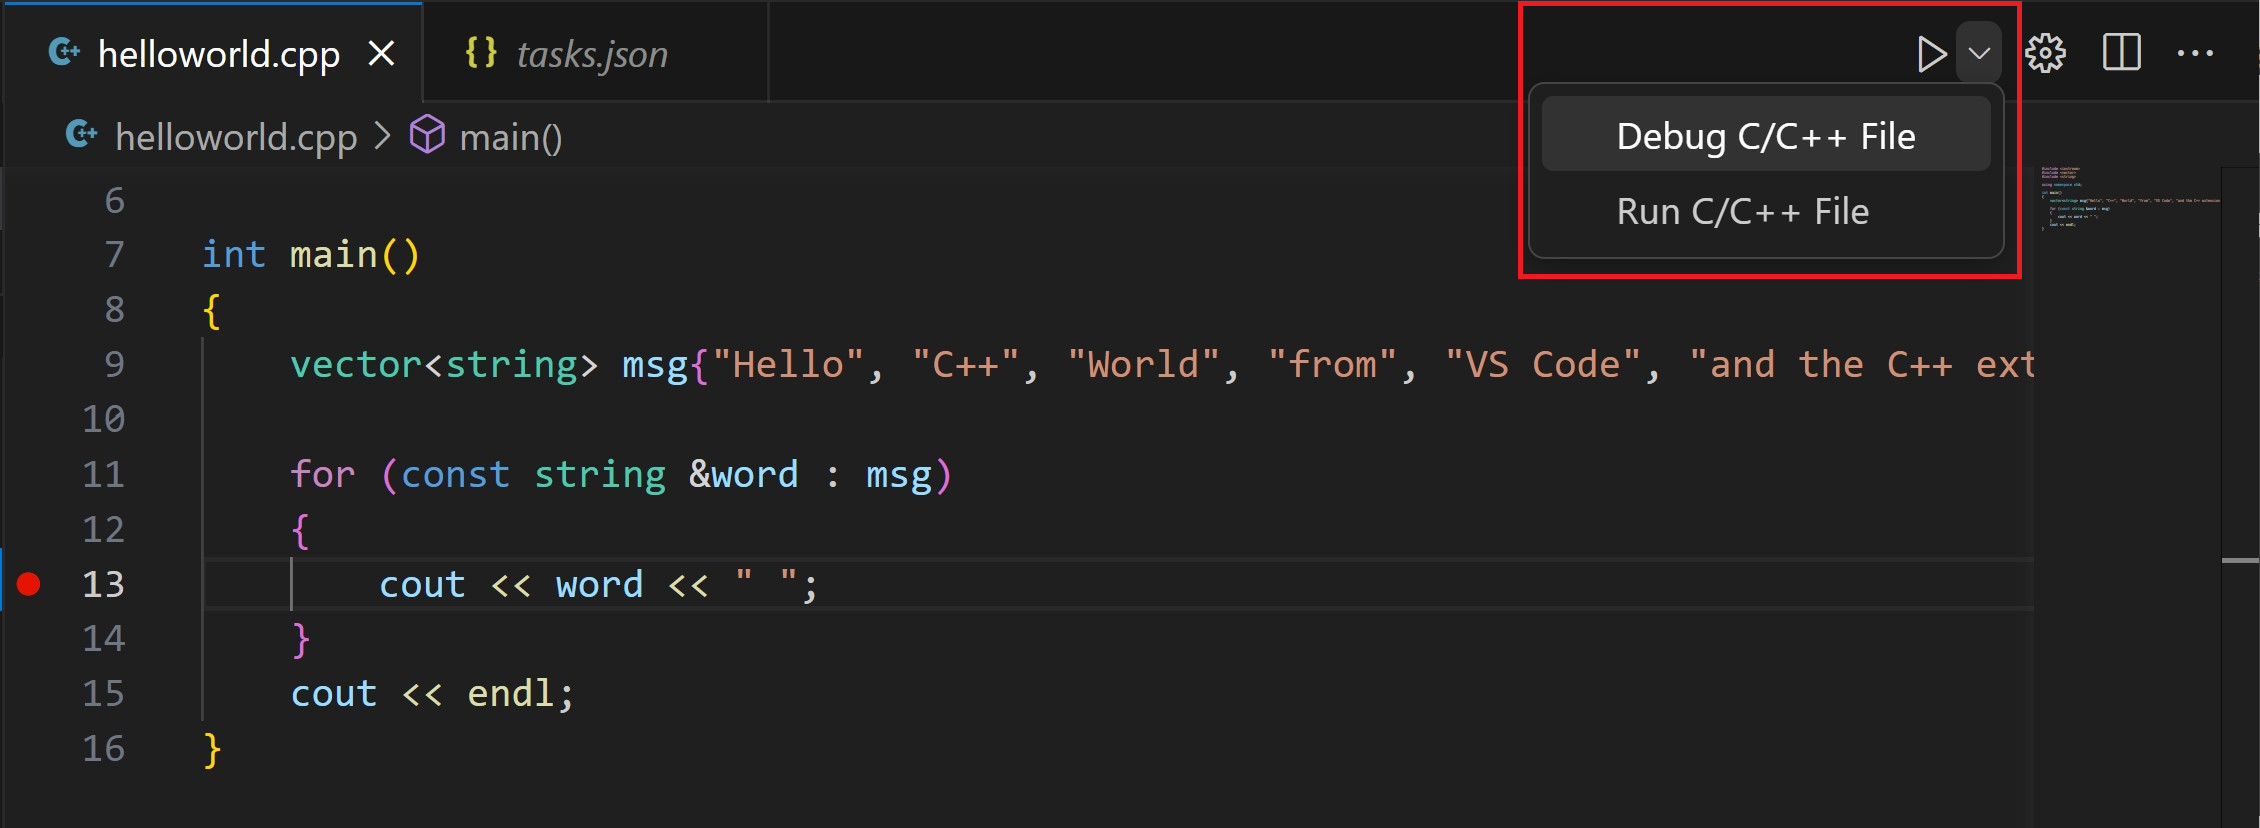
- From the drop-down next to the play button, select Debug C/C++ File.
- Choose C/C++: g++ build and debug active file from the list of detected compilers on your system (you’ll only be asked to choose a compiler the first time you run or debug helloworld.cpp ).
The play button has two modes: Run C/C++ File and Debug C/C++ File. It will default to the last-used mode. If you see the debug icon in the play button, you can just select the play button to debug, instead of using the drop-down.
Explore the debugger
Before you start stepping through the code, let’s take a moment to notice several changes in the user interface:
- The Integrated Terminal appears at the bottom of the source code editor. In the Debug Output tab, you see output that indicates the debugger is up and running.
- The editor highlights the line where you set a breakpoint before starting the debugger:
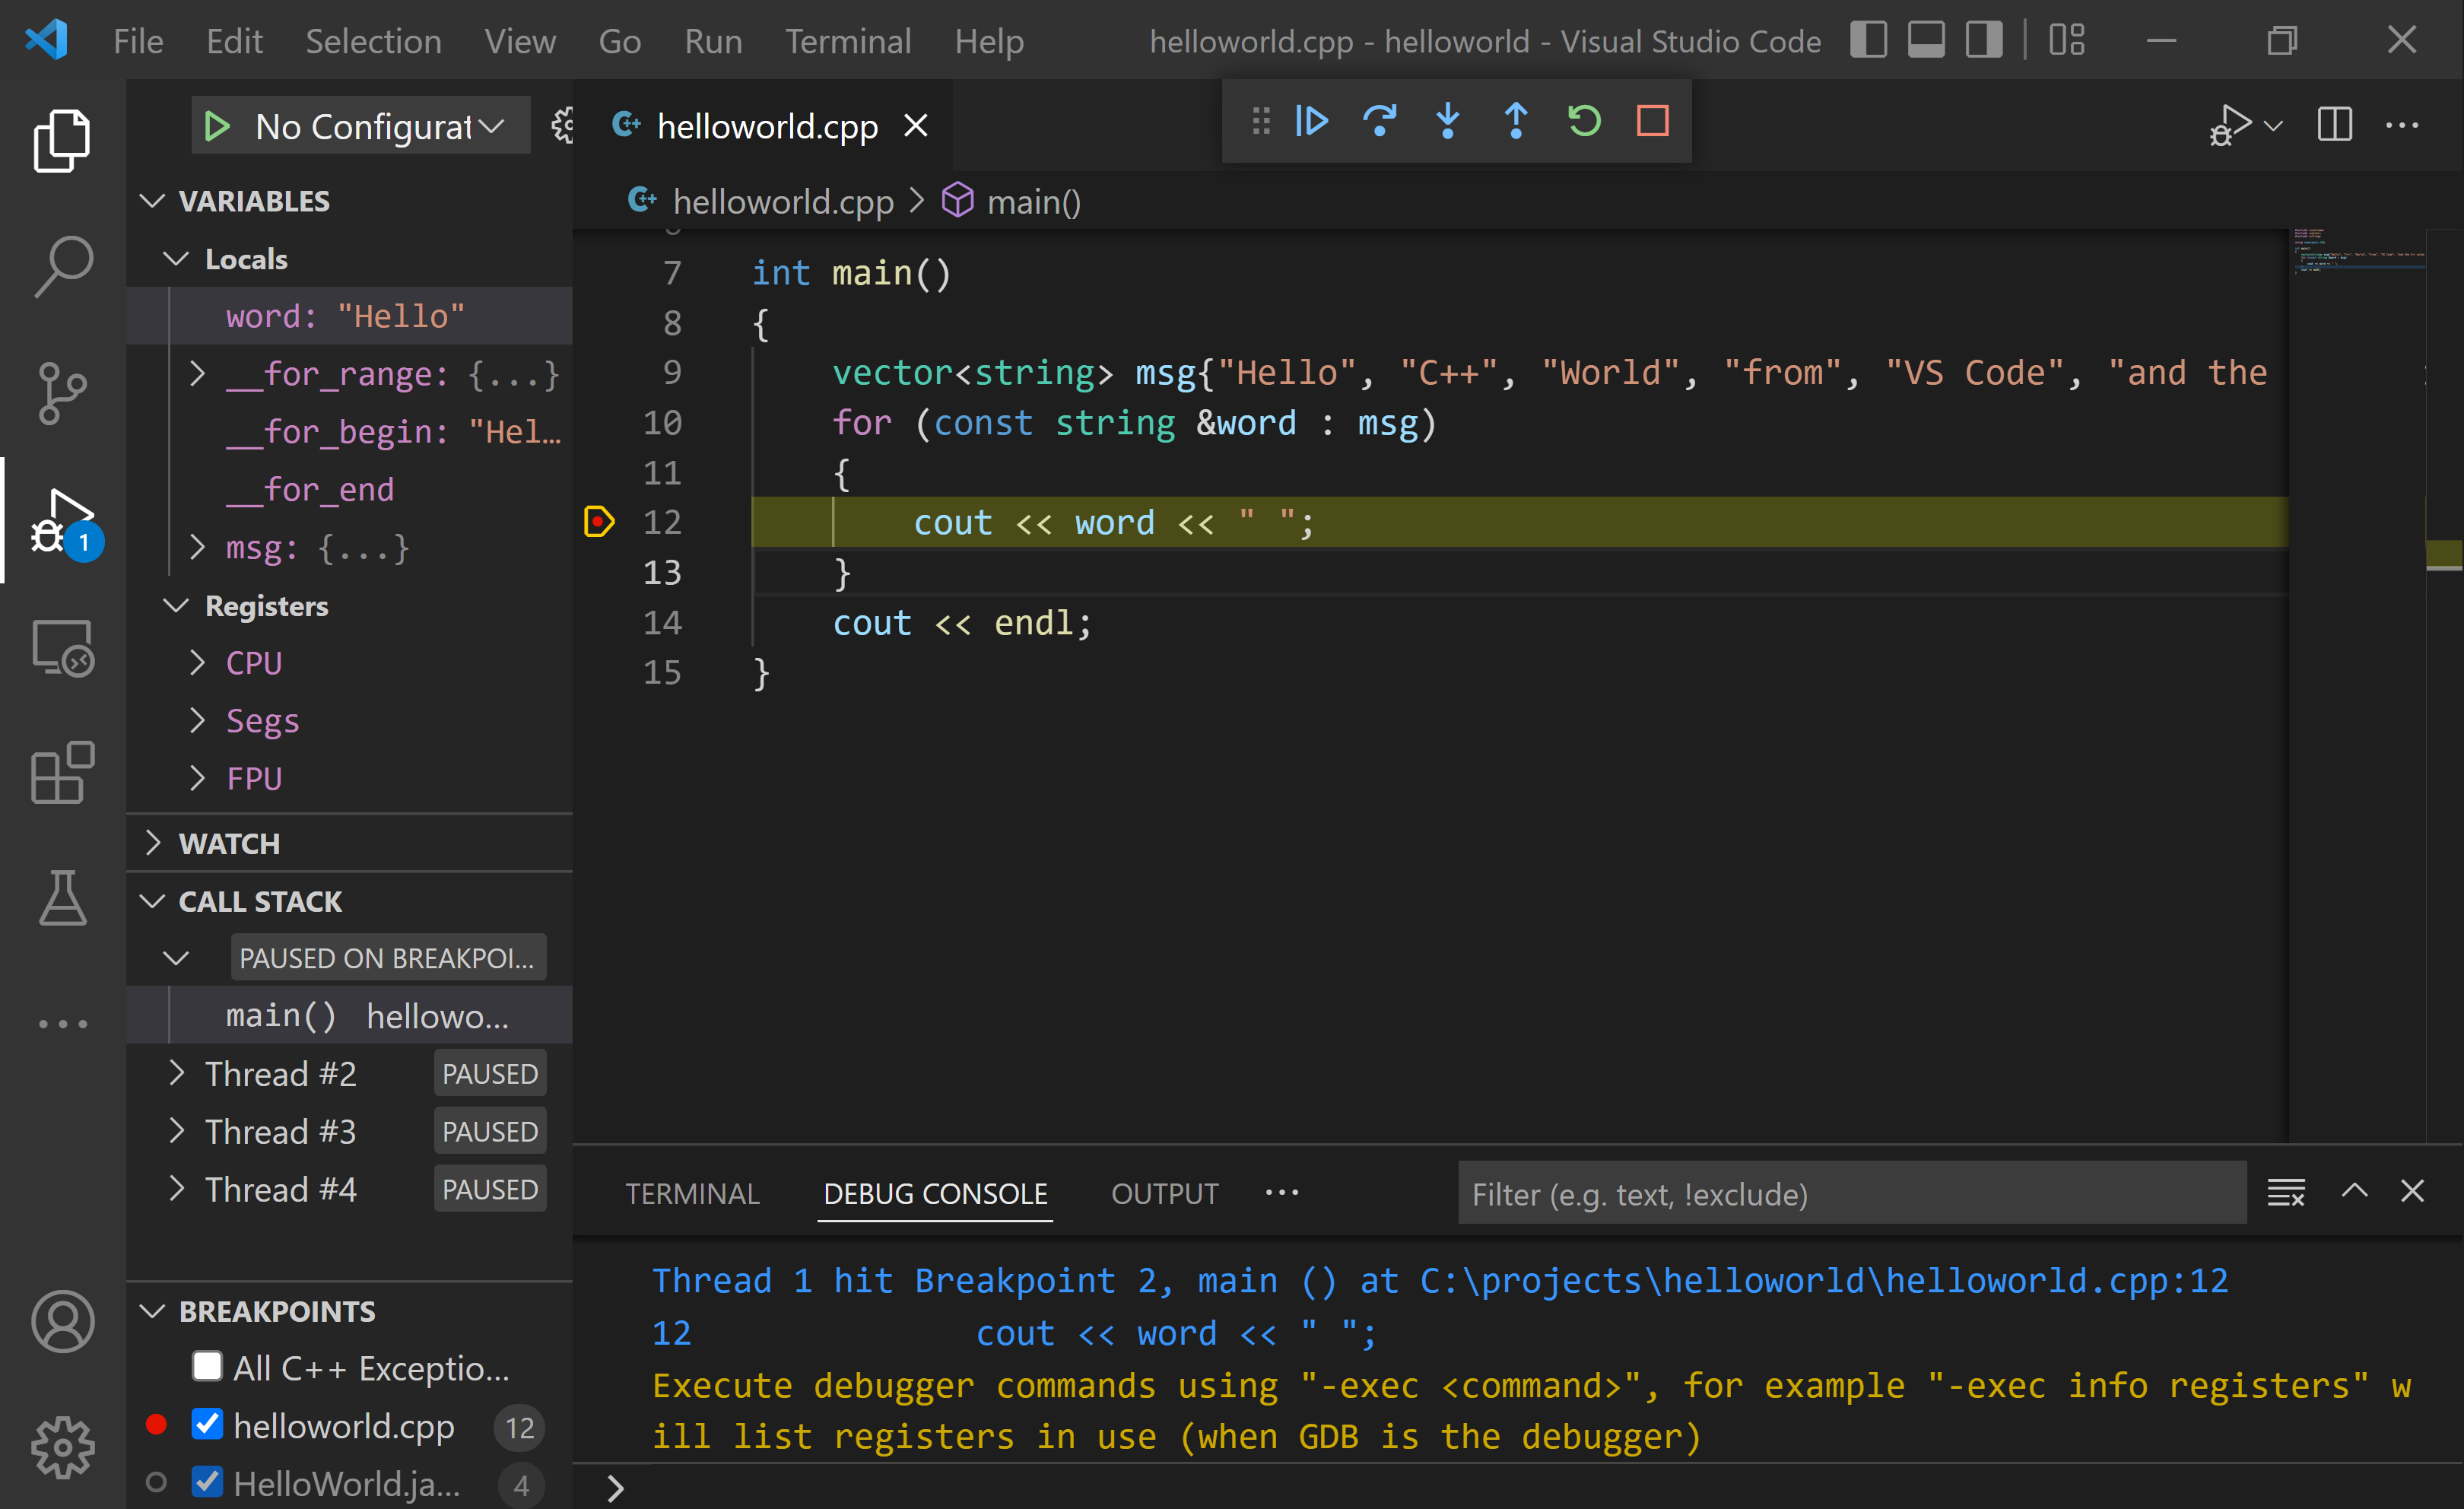
- The Run and Debug view on the left shows debugging information. You’ll see an example later in the tutorial.
- At the top of the code editor, a debugging control panel appears. You can move this around the screen by grabbing the dots on the left side.

Step through the code
Now you’re ready to start stepping through the code.
- Click or press the Step over icon in the debugging control panel.
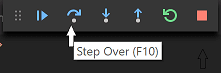 This will advance program execution to the first line of the for loop, and skip over all the internal function calls within the vector and string classes that are invoked when the msg variable is created and initialized. Notice the change in the Variables window on the left.
 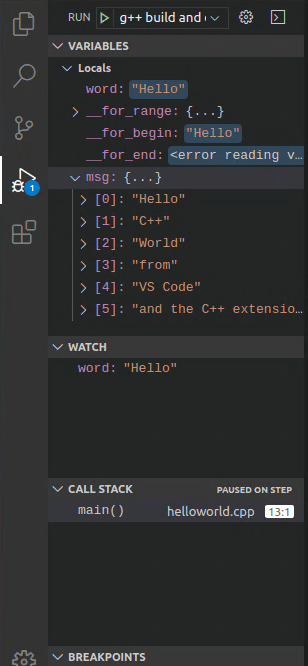 In this case, the errors are expected because, although the variable names for the loop are now visible to the debugger, the statement has not executed yet, so there is nothing to read at this point. The contents of msg are visible, however, because that statement has completed.
 - Press Step over again to advance to the next statement in this program (skipping over all the internal code that is executed to initialize the loop). Now, the Variables window shows information about the loop variables.
- Press Step over again to execute the cout statement. (Note that as of the March 2019 release, the C++ extension does not print any output to the Debug Console until the loop exits.)
- If you like, you can keep pressing Step over until all the words in the vector have been printed to the console. But if you are curious, try pressing the Step Into button to step through source code in the C++ standard library!
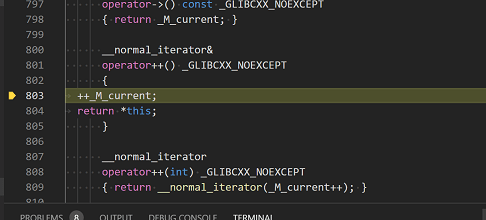 To return to your own code, one way is to keep pressing Step over. Another way is to set a breakpoint in your code by switching to the helloworld.cpp tab in the code editor, putting the insertion point somewhere on the cout statement inside the loop, and pressing F9 . A red dot appears in the gutter on the left to indicate that a breakpoint has been set on this line.
 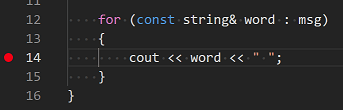 Then press F5 to start execution from the current line in the standard library header. Execution will break on cout . If you like, you can press F9 again to toggle off the breakpoint. When the loop has completed, you can see the output in the Integrated Terminal, along with some other diagnostic information that is output by GDB.
Set a watch
Sometimes you might want to keep track of the value of a variable as your program executes. You can do this by setting a watch on the variable.
- Place the insertion point inside the loop. In the Watch window, click the plus sign and in the text box, type word , which is the name of the loop variable. Now view the Watch window as you step through the loop.
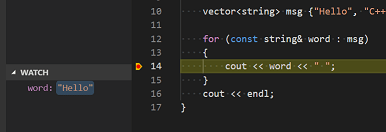
- Add another watch by adding this statement before the loop: int i = 0; . Then, inside the loop, add this statement: ++i; . Now add a watch for i as you did in the previous step.
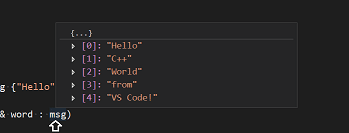
- To quickly view the value of any variable while execution is paused on a breakpoint, you can hover over it with the mouse pointer.
Customize debugging with launch.json
When you debug with the play button or F5 , the C++ extension creates a dynamic debug configuration on the fly.
There are cases where you’d want to customize your debug configuration, such as specifying arguments to pass to the program at runtime. You can define custom debug configurations in a launch.json file.
To create launch.json , choose Add Debug Configuration from the play button drop-down menu.
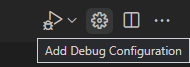
You’ll then see a dropdown for various predefined debugging configurations. Choose C/C++: g++.exe build and debug active file.
VS Code creates a launch.json file in the .vscode folder`, which looks something like this:
"configurations": [ "name": "C/C++: g++.exe build and debug active file", "type": "cppdbg", "request": "launch", "program": "$ \\$.exe", "args": [], "stopAtEntry": false, "cwd": "$", "environment": [], "externalConsole": false, "MIMode": "gdb", "miDebuggerPath": "C:\\msys64\\ucrt64\\bin\\gdb.exe", "setupCommands": [ "description": "Enable pretty-printing for gdb", "text": "-enable-pretty-printing", "ignoreFailures": true >, "description": "Set Disassembly Flavor to Intel", "text": "-gdb-set disassembly-flavor intel", "ignoreFailures": true > ], "preLaunchTask": "C/C++: g++.exe build active file" > ], "version": "2.0.0" > In the JSON above, program specifies the program you want to debug. Here it is set to the active file folder ( $ ) and active filename with the .exe extension ( $.exe ), which if helloworld.cpp is the active file will be helloworld.exe . The args property is an array of arguments to pass to the program at runtime.
By default, the C++ extension won’t add any breakpoints to your source code and the stopAtEntry value is set to false .
Change the stopAtEntry value to true to cause the debugger to stop on the main method when you start debugging.
From now on, the play button and F5 will read from your launch.json file when launching your program for debugging.
Adding additional C/C++ settings
If you want more control over the C/C++ extension, you can create a c_cpp_properties.json file, which will allow you to change settings such as the path to the compiler, include paths, C++ standard (default is C++17), and more.
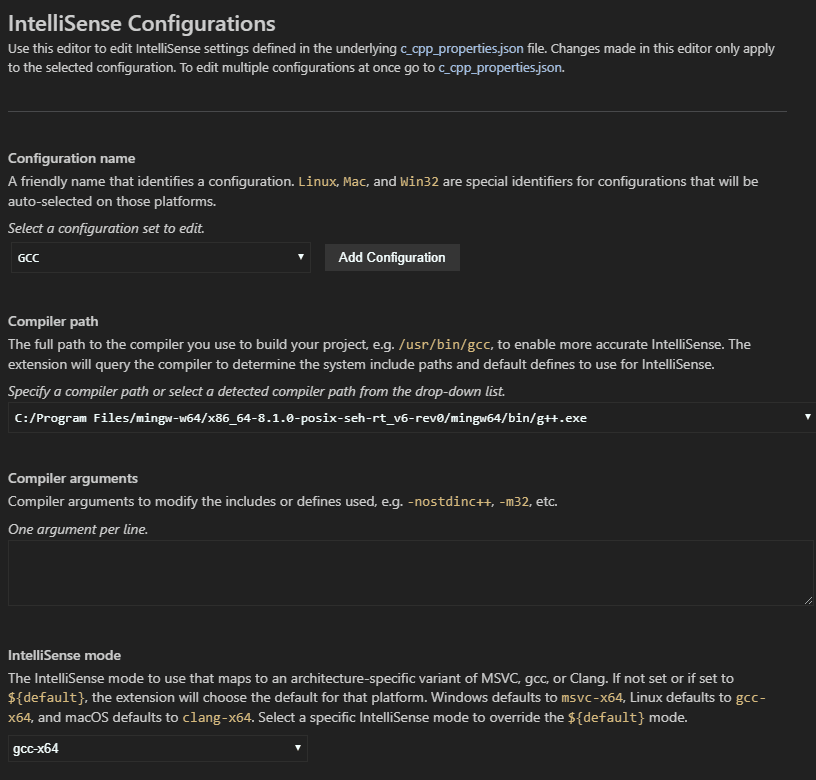
You can view the C/C++ configuration UI by running the command C/C++: Edit Configurations (UI) from the Command Palette ( ⇧⌘P (Windows, Linux Ctrl+Shift+P ) ).
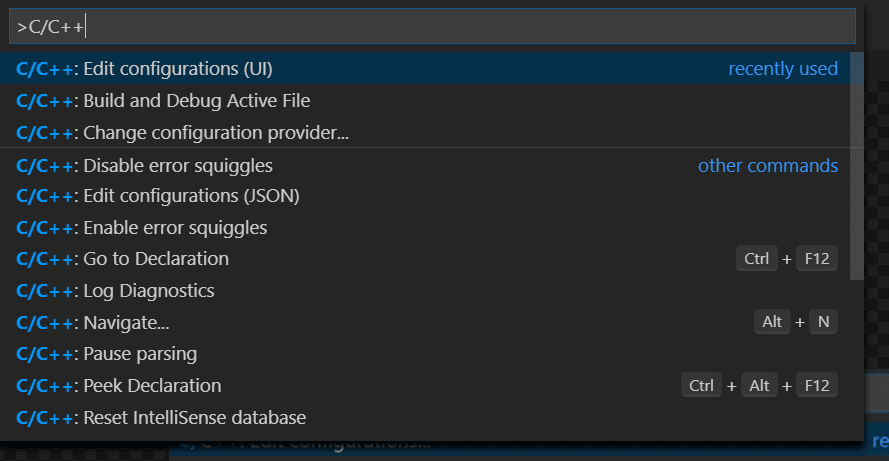
This opens the C/C++ Configurations page. When you make changes here, VS Code writes them to a file called c_cpp_properties.json in the .vscode folder.
Here, we’ve changed the Configuration name to GCC, set the Compiler path dropdown to the g++ compiler, and the IntelliSense mode to match the compiler (gcc-x64).
Visual Studio Code places these settings in .vscode\c_cpp_properties.json . If you open that file directly, it should look something like this:
"configurations": [ "name": "GCC", "includePath": ["$/**"], "defines": ["_DEBUG", "UNICODE", "_UNICODE"], "windowsSdkVersion": "10.0.22000.0", "compilerPath": "C:/msys64/mingw64/bin/g++.exe", "cStandard": "c17", "cppStandard": "c++17", "intelliSenseMode": "windows-gcc-x64" > ], "version": 4 > You only need to add to the Include path array setting if your program includes header files that are not in your workspace or in the standard library path.
Compiler path
The extension uses the compilerPath setting to infer the path to the C++ standard library header files. When the extension knows where to find those files, it can provide features like smart completions and Go to Definition navigation.
The C/C++ extension attempts to populate compilerPath with the default compiler location based on what it finds on your system. The extension looks in several common compiler locations.
The compilerPath search order is:
- First check for the Microsoft Visual C++ compiler
- Then look for g++ on Windows Subsystem for Linux (WSL)
- Then g++ for MinGW-w64.
If you have Visual Studio or WSL installed, you may need to change compilerPath to match the preferred compiler for your project. For example, if you installed MinGW-w64 version 8.1.0 using the i686 architecture, Win32 threading, and sjlj exception handling install options, the path would look like this: C:\Program Files (x86)\mingw-w64\i686-8.1.0-win32-sjlj-rt_v6-rev0\mingw64\bin\g++.exe .
Troubleshooting
MSYS2 is installed, but g++ and gdb are still not found
You must follow the steps on the MSYS2 website to use the MSYS CLI to install the full MinGW-w64 toolchain( pacman -S —needed base-devel mingw-w64-ucrt-x86_64-toolchain ), as well as all required prerequisites. The toolchain includes g++ and gdb.
As a Windows user, running the pacman command gives me an error
UCRT on Windows machines is only included in Windows 10 or later. If you are using another version of Windows, run the following command that does not use UCRT:
pacman -S --needed base-devel mingw-w64-x86_64-toolchain When adding the the MinGW-w64 destination folder to your list of environment variables, the default path will then be: C:\msys64\mingw64\bin .
MinGW 32-bit
If you need a 32-bit version of the MinGW toolset, consult the Downloading section on the MSYS2 wiki. It includes links to both 32-bit and 64-bit installation options.
Next steps
- Explore the VS Code User Guide.
- Review the Overview of the C++ extension.
- Create a new workspace, copy your .vscode JSON files to it, adjust the necessary settings for the new workspace path, program name, etc. and start coding!
Tutorial: Configure CLion on Windows
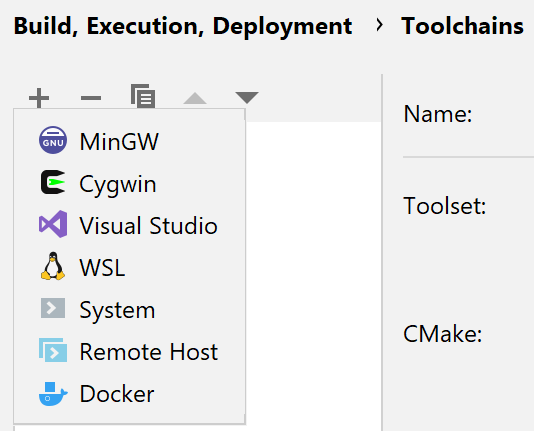
On Windows, CLion toolchains include the build tool, C and C++ compilers, debugger executable, and the environment. You can select one of the pre-defined toolchain setups (MinGW, Cygwin, Microsoft Visual C++, or WSL), Remote Host, Docker) or configure a custom toolchain (System):
Watch this video for an overview of Windows toolchain options:
If you don’t need to configure custom tools or don’t want to install additional software on your system, stick to MinGW (default) as it works out-of-the-box using the MinGW toolset bundled in CLion.
For more information about Remote Host toolchains, refer to Remote with local sources. If you are working with a Docker container, refer to Docker toolchain.
MinGW
CLion bundles a version of the MinGW toolset for quick setup. The exact version bundled is MinGW-w64 11 with languages=c,c++ , posix threads, and seh exceptions. You can use this bundled toolchain or switch to a custom MinGW installation.
Install MinGW (optional)

- Download and run the MinGW-w64 installer. It provides both 64- and 32-bit options.
- In the MinGW-w64 installation wizard, make sure to select the required architecture. Note that the default suggested option is 32-bit.
- Wait for installation to finish.
Although MinGW-w64 provides both 64- and 32-bit options, you can also install MinGW, the 32-bit-only version.

- In the MinGW installation wizard, select the following packages from the Basic Setup list: mingw-developer-tool , mingw32-base , mingw32-gcc-g++ , mingw32-msys-base .
- Wait for installation to finish.
Configure a MinGW toolchain
- Go to File | Settings | Build, Execution, Deployment | Toolchains . Click and select MinGW to add a new MinGW toolchain.
- In the Toolset field, you will see Bundled MinGW , which is the default option. If required, open the field to select from the list of other available installations:

- Wait until the tools detection finishes.

- Select the Debugger : you can use either bundled GDB, your MinGW GDB, or a custom GDB binary.
- Bundled GDB is recommended, since it is guaranteed to include Python support required for CLion data renderers.
- GDB does not yet support debugging on Windows ARM64. For this type of system, CLion’s bundled GDB is intended to be used for remote debugging only.
- If required, specify the script to initialize the environment.
- Click Apply when all the tools are set correctly.
When using a custom MinGW installation, if CLion cannot detect the compilers, double-check the installed packages in MinGW Installation Manager .
Cygwin
- Download the Cygwin installer, version 2.8 or later.
- Run the installer and select the following packages:
- gcc-g++
- gdb

To select a package, type its name in the Search field and set the version in the New column:

Windows Subsystem for Linux
You can use WSL, Windows Subsystem for Linux, as your working environment in CLion on Windows 10 (starting the Fall Creators Update version 1709, build 16299.15).
WSL toolchain enables you to build projects using CMake and compilers from Linux and run/debug on WSL without leavCLionLion running on your Windows machine.
For more information about setting up WSL on your system and configuring WSL toolchains, refer to WSL guide.

Microsoft Visual C++

- Install Visual Studio 2013, 2015, 2017, 2019, or 2022 on your system.
- In CLion, go to File | Settings | Build, Execution, Deployment | Toolchains .
- Click and select Visual Studio from the list of toolchain templates.
- Check the Toolset field. CLion will attempt to automatically detect the installed Visual Studio distribution. If the detection fails, set the path to Visual Studio manually.
- If required, specify the Architecture ( x86 , amd64 , x86_arm , or another), Platform ( store , uwp , onecore , or leave it blank), and Version . To build your project for the selected architecture, CLion will call the script to configure the environment with the specified parameters. If the version of your compiler toolset is earlier than the version of your Visual Studio installation, pass it in the Version field via the vcvars_ver flag, for example, -vcvars_ver=14.16 .
- Wait until the tools detection is finished:
- If required, specify the script to initialize the environment.
MSVC compiler
CLion supports the Microsoft Visual C++ compiler that ships with Visual Studio 2013, 2015, 2017, 2019, and 2022.
- __uuidof , __forceinline , __unaligned , and __alignof keywords;
- pointer type attributes: __ptr32 , __ptr64 , __uptr , __sptr ;
- MSVC built-in data types: (unsigned) __int8 , (unsigned) __int16 , (unsigned) __int32 , (unsigned) __int64 , __wchar_t ;
- additional format specifiers, such as %I32 and %I64 ;
- the clang’s -fms-extensions flag.
Clang-cl compiler
As an alternative compiler, you can use clang-cl — the MSVC-compatible compiler driver for Clang. CLion supports clang-cl version 8.0 and later.

- Install clang-cl from the LLVM site or along with the Visual Studio tools. When installed from the LLVM site, the clang-cl binary can be found at the standard location C:\Program Files\LLVM\bin\clang-cl.exe for the 64-bit version or C:\Program Files (x86)\LLVM\bin\clang-cl.exe for the 32-bit version.
- In CLion, go to File | Settings | Build, Execution, Deployment | Toolchains and select the Visual Studio toolchain that you want to configure, or create a new one.
- Point the C Compiler and C++ Compiler fields to clang-cl.exe . CLion will suggest the paths detected automatically.
Note that currently the -T clangcl options can’t be picked up if the bundled CMake is in use along with the Visual Studio toolchain setup (CPP-18848).
MSVC debugger
The MSVC toolchain debugger is implemented on top of LLDB, and it can work with native visualizers from the Visual Studio installation or from your project.

To enable native visualizers support and set the desired diagnostics level, select the Enable NatVis renderers for LLDB checkbox in Settings | Build, Execution, Deployment | Debugger | Data Views | C/C++ :
CLion automatically generates one-line summaries for all structures not covered by Natvis and highlights them to increase readability. Also, the built-in formatters provide visualization for wide/Unicode strings ( wchar_t , char16_t , char32_t ).

If you have custom native visualizers in your project, CLion will use them as well.
When using the MSVC toolchain debugger, you can enable symbol servers support which will help the debugger resolve library symbols correctly. For more information, refer to Using symbol servers when debugging on Windows.
System toolchain
The System toolchain on Windows allows configuring the build tool, compilers, and debugger without selecting a predefined toolset or environment, similarly to Linux and macOS. Use this toolchain option for embedded development cases like using ARM or for other custom setups.

- Go to File | Settings | Build, Execution, Deployment | Toolchains .
- Click and select System to add a new System toolchain.
- Configure the tools and provide an environment script if required:
Initializing the toolchain environment via a script
Instead of setting the environment manually, you can point CLion to an environment file — a script that initializes the environment for your project. This is helpful, for example, when you need to initialize compiler variables, add custom ones, or modify the PATH .
For all toolchains except Docker, environment sourcing only happens once, the first time the toolchain in used in a CMake profile, or upon loading a Makefile.
If you make changes in the script, it will be re-sourced automatically. There is also a feature request for manual script reload.
For the case of the Docker toolchain, sourcing happens each time the toolchain is used.
Toolchain environment affects all steps performed with that particular toolchain, which includes CMake generation, build, and binary launch.
- In the toolchain settings, click Add environment , then click From file :

- In the Environment file field, specify the path to the script:

- You will get notifications in case of script loading issues. CLion also checks the script loading time and terminates the execution if it takes too long.

Clang compiler on Windows
With CMake 3.15, it has become possible to use the Clang compiler on Windows with the MinGW-w64/MinGW toolchain.
However, the LLVM Clang for Windows is built using Microsoft Visual Studio, and all the built-in macros and include search paths are set up for use with Visual Studio. So if you take Clang from the LLVM repository, it will not work correctly when configured with the MinGW toolchain. One of the possible workarounds is described below.
Set up the Clang compiler for MinGW
- Install MSYS2.
- In the MSYS terminal, run the following pacman command to download the complete set of packages built with clang:
pacman -S mingw-w64-clang-x86_64-toolchain
Run one more command to get the MinGW-w64 GDB debugger:
pacman -S mingw-w64-clang-x86_64-gdb

With this new toolchain configured, you can build the project and start using the Clang’s advances tools, such as profile-guided optimization. Take a look at this blogpost for instructions.
GDB on Windows
In the case of MinGW, CLion includes the bundled GDB (version 13.1). For Cygwin, you need to install the GDB package in the Cygwin Package Manager, as described in the Cygwin section of this guide.
You can also switch to a custom GDB binary. In this case, the supported GDB versions are 7.8.x-13.1.
Note that for GDB 8.0 and later, debugger output is redirected to CLion console by default. To enable opening an external console window for application input/output, go to Help | Find Action or press Control+Shift+A , search for Registry , and set the following key: cidr.debugger.gdb.workaround.windows.forceExternalConsole .
Как установить gcc в visual studio code
Инструкция работает для Ubuntu, но может частично работать и в других дистрибутивах Linux
1. Редактор
Загрузите Visual Studio Code (deb-пакет) с адреса code.visualstudio.com.
- откройте терминал и перейдите в каталог, в котором лежит deb-пакет
- запустите команду dpkg -i code_*.deb и проверьте результат выполнения
- если не хватает каких-либо зависимостей, установите их через apt-get install
2. Последняя версия G++
В первую очередь проверьте версию g++ командой g++ —version . Если у вас версия 7 или выше, всё в порядке. Вывод команды выглядит примерно так:
sergey@sergey-A17:~$ g++ --version g++ (Ubuntu 7.2.0-1ubuntu1~16.04) 7.2.0 Copyright (C) 2017 Free Software Foundation, Inc. This is free software; see the source for copying conditions. There is NO warranty; not even for MERCHANTABILITY or FITNESS FOR A PARTICULAR PURPOSE. Если версия ниже 7.0, то надо обновить компилятор. Подключите PPA ubuntu-toolchain-r. Это можно сделать двумя командами:
sudo add-apt-repository ppa:ubuntu-toolchain-r/test sudo apt-get update Теперь надо установить новый компилятор:
sudo apt-get install g++-7 После этого надо установить новый компилятор по умолчанию:
sudo update-alternatives --install /usr/bin/g++ g++ /usr/bin/g++-7 40 sudo update-alternatives --install /usr/bin/gcc gcc /usr/bin/gcc-7 40 Снова проверьте версию G++. Поскольку он доступен под разными именами, надо проверить их все.
g++ --version c++ --version cpp --version gcc --version cc --version Если что-то не сходится, используйте команды:
sudo update-alternatives --install /usr/bin/g++ g++ /usr/bin/g++-7 40 sudo update-alternatives --install /usr/bin/c++ g++ /usr/bin/g++-7 40 sudo update-alternatives --install /usr/bin/cpp g++ /usr/bin/g++-7 40 sudo update-alternatives --install /usr/bin/gcc gcc /usr/bin/gcc-7 40 sudo update-alternatives --install /usr/bin/cc gcc /usr/bin/gcc-7 40 sudo update-alternatives --config g++ sudo update-alternatives --config c++ sudo update-alternatives --config cpp sudo update-alternatives --config gcc sudo update-alternatives --config cc 3. Последняя версия CMake
Перед началом удалите существующую версию CMake, если CMake установлен: sudo apt-get remove cmake . Если CMake не был установлен, всё в порядке.
Далее потребуется собрать CMake вручную. Установите пакеты, необходимые для сборки:
sudo apt-get update sudo apt-get install build-essential checkinstall Зайдите на страницу загрузки (cmake.org) и скачайте пакет “Unix/Linux Source” актуальной версии. Распакуйте загруженный архив, перейдите в каталог и выполните следующие команды:
./configure make -s -j4 Далее выполните команду checkinstall, чтобы создать DEB-пакет “cmake-custom” и установить его. Также вам нужно удалить системный пакет cmake перед началом установки.
# Удаляем существующую версию CMake sudo apt-get remove cmake # Создаём и устанавливаем пакет cmake-custom-3.9.4 sudo checkinstall -D \ -y --strip --stripso --nodoc \ --pkgname=cmake-custom \ --provides=cmake \ --pkgversion=3.9.4 \ --pkgrelease=latest \ --deldesc=no Если скрипт завершился успешно, проверьте версию cmake в системе командой cmake —version :
>cmake --version cmake version 3.8.1 CMake suite maintained and supported by Kitware (kitware.com/cmake). 4. Библиотека SFML
Рекомендуется использовать самую новую версию SFML. Для этого нужно скачать на sfml-dev.org архив с исходным кодом SFML и собрать его с помощью CMake.
# Установим зависимости для сборки sudo apt-get install libfreetype6-dev libpng-dev # Собираем SFML из исходного кода cmake --DCMAKE_BUILD_TYPE=Release -DBUILD_SHARED_LIBS=OFF . cmake --build . -- -j4 # Устанавливаем, создавая пакет libsfml-dev-custom версии 2.4.2 sudo checkinstall -D \ -y --strip --stripso --nodoc \ --pkgname=libsfml-dev-custom \ --pkgversion=2.4.2 \ --pkgrelease=git \ --deldesc=no 5. Добавляем модуль FindSFML.cmake
- Перейдите в каталог /usr/local/share/cmake-3.9/Modules (либо /usr/share/cmake-3.9/Modules , если предыдущего не существует)
- Скопируйте в этот каталог файл FinSFML.cmake (для записи потребуются права администратора; возможно, будет удобнее скопировать командой sudo cp )
PS-Group
- PS-Group
- sshambir@gmail.com
- ps-group
- image/svg+xml sshambir
Материалы для курсов в Институте Программных Систем и в Волгатехе
Загрузка, установка и настройка рабочей нагрузки Linux
Проекты Linux поддерживаются в Visual Studio версии 2017 и выше. Чтобы увидеть документацию для этих версий, установите в данной статье селектор Версия Visual Studio в Visual Studio 2017 или Visual Studio 2019. Он находится в верхней части оглавления на этой странице.
Вы можете использовать интегрированную среду разработки Visual Studio в Windows для создания, редактирования и отладки проектов C++, которые выполняются в удаленной системе Linux, на виртуальной машине или в подсистеме Windows для Linux.
Вы можете работать с имеющейся базой кода, где CMake не требуется преобразовывать в проект Visual Studio. Если база кода является кроссплатформенной, в Visual Studio можно создавать решения как для Windows, так и для Linux. Например, с помощью Visual Studio можно редактировать, выполнять сборку и отлаживать свой код в Windows. Затем можно быстро перенацелить проект для Linux на сборку и отладку в среде Linux. Файлы заголовков Linux автоматически копируются на ваш локальный компьютер. Visual Studio использует их для обеспечения полной поддержки технологии IntelliSense (завершение операторов, переход к определению и т. д.).
Чтобы использовать любой из этих сценариев, требуется рабочая нагрузка Разработка для Linux на C++.
Установка Visual Studio
- В поле поиска Windows введите «Visual Studio Installer»:

- Найдите установщик в разделе Приложения и дважды щелкните его. Когда откроется установщик, нажмите кнопку «Изменить» и перейдите на вкладку «Рабочие нагрузки». Прокрутите вниз до других наборов инструментов и выберите разработку Linux с помощью рабочей нагрузки C++.
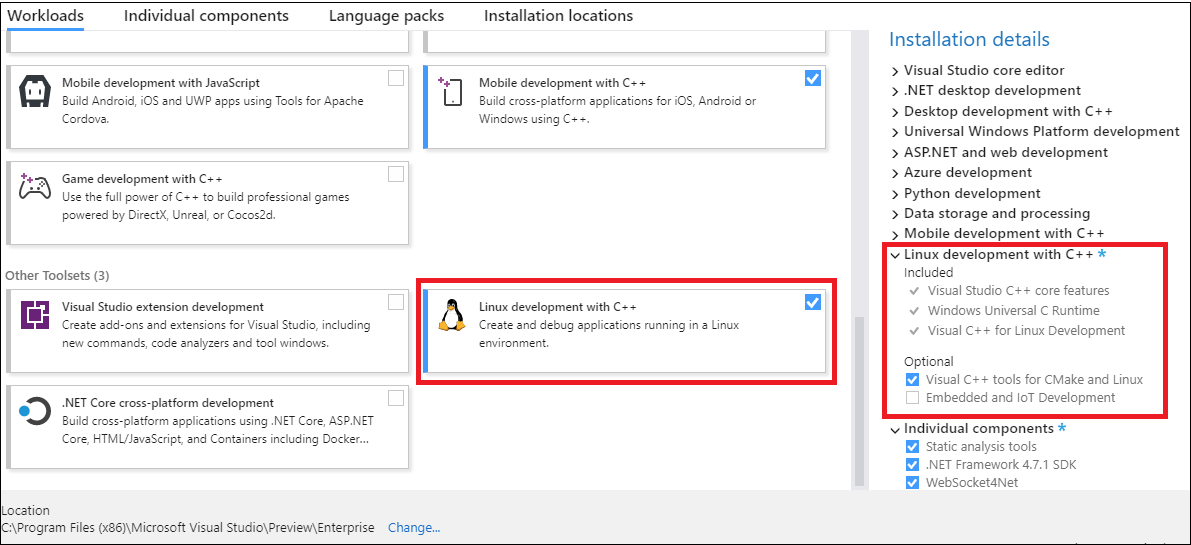
Выбрана рабочая нагрузка разработки Linux. Выделена область сведений об установке, в которой перечислены сведения, включенные в рабочую нагрузку. В состав которых входят основные функции Visual Studio C++, среда выполнения Windows Universal C, разработка Visual C++ для Linux. Также выбран дополнительный компонент: средства Visual C++ для CMake и Linux.
Варианты создания среды Linux
Если у вас нет компьютера Linux, можно создать виртуальную машину Linux в Azure. Дополнительные сведения см. в статье Краткое руководство. Создание виртуальной машины под управлением Linux на портале Azure.
В Windows 10 и более поздних версий можно установить и настроить использование определенного дистрибутива Linux в подсистеме Windows для Linux (WSL). См. подробнее руководство по установке подсистемы Windows для Linux в Windows 10. Если не удается получить доступ к Microsoft Store, можете вручную скачать пакеты дистрибутивов WSL. WSL — это удобная консольная среда, но ее не рекомендуется использовать для графических приложений.
Для проектов Linux в Visual Studio необходимо установить следующие зависимости в удаленной системе Linux или WSL:
- Компилятор — Visual Studio 2019 и более поздних версий полностью поддерживает GCC и Clang.
- gdb — Visual Studio автоматически запускает gdb в системе Linux и использует интерфейс отладчика Visual Studio для обеспечения всех возможностей отладки в Linux.
- rsync и zip — благодаря включению rsync и zip Visual Studio может извлекать файлы заголовков из системы Linux в файловую систему Windows для использования технологией IntelliSense.
- make
- openssh-server (только удаленные системы Linux) — Visual Studio подключается к удаленным системам Linux через безопасное SSH-соединение.
- CMake (только для проектов CMake) — вы можете установить статически связанные двоичные файлы CMake для Linux.
- ninja-build (только для проектов CMake) — Ninja является генератором по умолчанию для конфигураций Linux и WSL в Visual Studio 2019 версии 16.6 или более поздней версии.
В следующих командах предполагается, что вы используете g++ вместо clang.
Для проектов Linux в Visual Studio необходимо установить следующие зависимости в удаленной системе Linux или WSL:
- gcc — Visual Studio 2017 полностью поддерживает GCC.
- gdb — Visual Studio автоматически запускает gdb в системе Linux и использует интерфейс отладчика Visual Studio для обеспечения всех возможностей отладки в Linux.
- rsync и zip — благодаря включению rsync и zip Visual Studio может извлекать файлы заголовков из системы Linux в файловую систему Windows для использования технологией IntelliSense.
- make
- openssh-server — Visual Studio подключается к удаленным системам Linux через защищенное SSH-соединение.
- CMake (только для проектов CMake) — вы можете установить статически связанные двоичные файлы CMake для Linux.
Настройка Linux: Ubuntu в WSL
Если вы используете WSL, для сборки и отладки не требуется добавлять удаленное подключение или настраивать SSH. Использование zip и rsync является обязательным для автоматической синхронизации заголовков Linux в Visual Studio и включения поддержки Intellisense. ninja-build требуется только для проектов CMake. Если необходимые приложения отсутствуют, их можно установить с помощью следующей команды:
sudo apt-get install g++ gdb make ninja-build rsync zip Использование Ubuntu в удаленных системах Linux
В целевой системе Linux должны быть установлены openssh-server, g++, gdb и make. ninja-build требуется только для проектов CMake. Должна быть запущена управляющая программа ssh. Использование zip и rsync необходимо для автоматической синхронизации удаленных заголовков на локальном компьютере, чтобы обеспечить поддержку Intellisense. Если этих приложений еще нет, их можно установить следующим образом.
-
В командной строке оболочки на компьютере Linux выполните следующую команду:
sudo apt-get install openssh-server g++ gdb make ninja-build rsync zip sudo service ssh start Использование Fedora в WSL
В Fedora используются установщик пакетов dnf. Чтобы скачать g++, gdb, make, rsync, ninja-build и zip, выполните следующую команду:
sudo dnf install gcc-g++ gdb rsync ninja-build make zip Использование zip и rsync является обязательным для автоматической синхронизации заголовков Linux в Visual Studio и включения поддержки Intellisense. ninja-build требуется только для проектов CMake.
Использование Fedora в удаленных системах Linux
На целевой машине под управлением Fedora используются установщик пакетов dnf. Чтобы скачать openssh-server, g++, gdb, make, ninja-build, rsync и zip, а затем перезапустить управляющую программу ssh, сделайте следующее: ninja-build требуется только для проектов CMake.
-
В командной строке оболочки на компьютере Linux выполните следующую команду:
sudo dnf install openssh-server gcc-g++ gdb ninja-build make rsync zip sudo systemctl start sshd Дальнейшие действия
Теперь вы можете создать или открыть проект Linux, а также настроить его для выполнения в целевой системе. Дополнительные сведения см. в разделе:
- Создание нового проекта Linux на основе MSBuild C++
- Настройка проекта Linux CMake