
Настройка разработки Visual Studio Code для Go
В этом кратком руководстве описано, как установить и настроить расширение Go для Visual Studio Code .
В результатах опроса разработчиков Go 2020 41% респондентов выбрали Visual Studio Code в качестве наиболее предпочтительного редактора для Go. Это делает Visual Studio Code самым популярным редактором для разработчиков Go.
Visual Studio Code и расширение Go предоставляют IntelliSense, навигацию по коду и расширенную отладку. В этом кратком руководстве описана настройка Visual Studio Code. Затем вы напишете, запустите и отладите пример программы Go.
1. Установка Go
Выполните следующие действия, чтобы установить Go:
- В веб-браузере перейдите к go.dev/doc/install.
- Скачайте версию операционной системы.
- После скачивания запустите установщик.
- Откройте командную строку, а затем выполните команду go version , чтобы подтвердить установку Go.
2. Установка Visual Studio Code
Выполните следующие действия, чтобы установить Visual Studio Code:
- В веб-браузере перейдите к code.visualstudio.com.
- Скачайте версию операционной системы, поддерживает Windows, Linux и macOS.
- После скачивания запустите установщик. Это займет всего минуту.
3. Установка расширения Go
| Instructions | Снимок экрана |
|---|---|
| В Visual Studio Code откройте представление расширений, щелкнув значок расширений на панели действий. Или используйте сочетание клавиш (CTRL+SHIFT+X). | 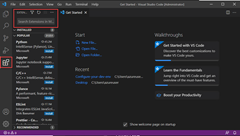 |
| Найдите расширение Go, а затем выберите установку. | 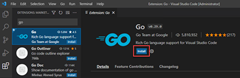 |
4. Обновление средств Go
| Instructions | Снимок экрана |
|---|---|
| В Visual Studio Code откройте справку>палитры команд для отображения всех команд. Или используйте сочетание клавиш (CTRL+SHIFT+P) | |
| Go: Install/Update tools Выполните поиск команды из поддона. | 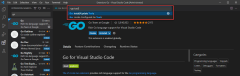 |
| При появлении запроса выберите все доступные средства Go и нажмите кнопку «ОК». | 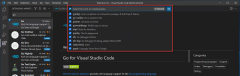 |
| Дождитесь завершения обновления инструментов Go. | 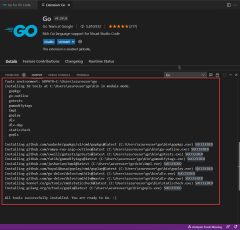 |
5. Создание примера программы Go
| Instructions | Снимок экрана |
|---|---|
| В Visual Studio Code откройте папку, в которой вы создадите корневой каталог приложения Go. Чтобы открыть папку, щелкните значок Обозреватель на панели действий и нажмите кнопку «Открыть папку«. | 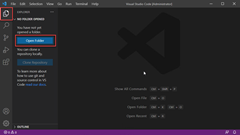 |
| Щелкните «Создать папку» на панели Обозреватель, а затем создайте корневой директор для примера приложения Go с именем sample-app | 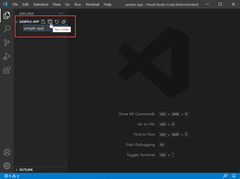 |
| Нажмите кнопку «Создать файл» на панели Обозреватель, а затем назовите файл main.go | 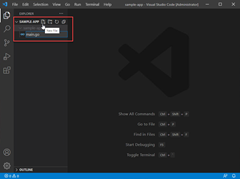 |
| Откройте терминал, терминал New Terminal>, а затем выполните команду go mod init sample-app , чтобы инициализировать пример приложения Go. | 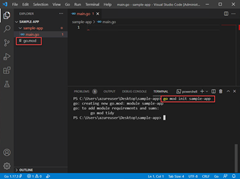 |
| Скопируйте следующий код в main.go файл. | 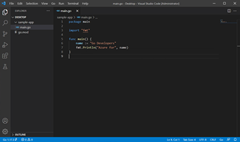 |
package main import "fmt" func main()
6. Запуск отладчика
| Instructions | Снимок экрана |
|---|---|
| Создайте точку останова в строке 7, щелкнув слева слева от нумерованной строки. Или поместите курсор на строку 7 и нажмите клавишу F9. | 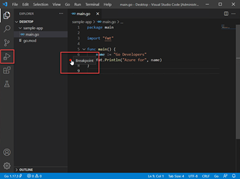 |
| Откройте представление отладки, щелкнув значок отладки на панели действий на стороне Visual Studio Code. Или используйте сочетание клавиш (CTRL+SHIFT+D). | 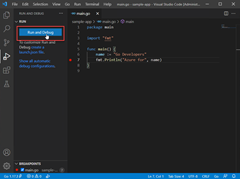 |
| Нажмите кнопку «Запуск и отладка» или нажмите клавишу F5, чтобы запустить отладчик. Затем наведите указатель мыши на переменную name в строке 7, чтобы увидеть его значение. Закройте отладчик, нажав кнопку «Продолжить » на панели отладчика или нажмите клавишу F5. | 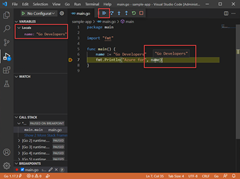 |
Go in Visual Studio Code
Using the Go extension for Visual Studio Code, you get features like IntelliSense, code navigation, symbol search, testing, debugging, and many more that will help you in Go development.

You can install the Go extension from the VS Code Marketplace.
Watch «Getting started with VS Code Go» for an explanation of how to build your first Go application using VS Code Go.
This article describes only a subset of the features the Go extension provides. See the extension’s documentation for the full, up-to-date list of supported features.
IntelliSense
IntelliSense features are provided by the Go language server, gopls, maintained by the Go team. You can configure the behavior of gopls using the gopls settings.
Semantic syntax highlighting
For better syntax highlighting than the default TextMate-based syntax highlighting, we recommend enabling semantic highlighting by turning on Gopls’ ui.semanticTokens setting.
"gopls": "ui.semanticTokens": true > Auto completions
As you type in a Go file, you can see IntelliSense providing you with suggested completions. This even works for members in current, imported, and not yet imported packages. Just type any package name followed by . , and you will get suggestions for the corresponding package members.
Tip: Use ⌃Space (Windows, Linux Ctrl+Space ) to trigger the suggestions manually.
Hover information
Hovering on any variable, function, or struct will give you information on that item such as documentation, signature, etc.
Signature help
When you open the ( while calling a function, a pop-up provides signature help for the function. As you keep typing the parameters, the hint (underline) moves to the next parameter.
Tip: Use ⇧⌘Space (Windows, Linux Ctrl+Shift+Space ) to manually trigger the signature help when the cursor is inside the () in the function call.
Code navigation
Code Navigation features are available in the context menu in the editor.
- Go to Definition F12 — Go to the source code of the type definition.
- Go to Type Definition — Go to the type that defines a symbol.
- Peek Definition ⌥F12 (Windows Alt+F12 , Linux Ctrl+Shift+F10 ) — Bring up a Peek window with the type definition.
- Go to References ⇧F12 (Windows, Linux Shift+F12 ) — Show all references for the type.
- Show Call Hierarchy ⇧⌥H (Windows, Linux Shift+Alt+H ) — Show all calls from or to a function.
- Go to Implementations ⌘F12 (Windows, Linux Ctrl+F12 ) — Bring up a Peek window with the list of all implementations of an interface (if triggered with an interface type symbol), or interfaces a type implements (if triggered with a concrete type symbol).
- Find All Implementations — Show all implementation of an interface (if triggered with an interface type symbol), or interfaces a type implements (if triggered with a concrete type symbol).
You can navigate via symbol search using the Go to Symbol commands from the Command Palette ( ⇧⌘P (Windows, Linux Ctrl+Shift+P ) ).
- Go to Symbol in File — ⇧⌘O (Windows, Linux Ctrl+Shift+O )
- Go to Symbol in Workspace — ⌘T (Windows, Linux Ctrl+T )
You can also navigate back and forth between a Go file and its test implementation using the Go: Toggle Test File command.
Build and diagnose
The Go language server ( gopls ) detects build and vet errors found on the workspace. The errors and warnings from running any/all of the above will be shown red/green squiggly lines in the editor. These diagnostics also show up in the Problems panel (View > Problems).
You can add additional lint checks using the go.lintOnSave setting and configuring your choice of linting tool ( staticcheck , golangci-lint , or revive ) using the go.lintTool setting.
Formatting
You can format your Go file using ⇧⌥F (Windows Shift+Alt+F , Linux Ctrl+Shift+I ) or by running the Format Document command from the Command Palette or the context menu in the editor.
By default, formatting is run when you save your Go file. You can disable this behavior by setting editor.formatOnSave to false for the [go] language identifier. You can change this using your JSON setting files.
"[go]": "editor.formatOnSave": false > When you have multiple formatters activated for Go files, you can select the Go extension as the default formatter.
"[go]": "editor.defaultFormatter": "golang.go" > Formatting is provided by gopls . If you want gofumpt -style formatting, you can configure gopls to use gofumpt .
"gopls": "formatting.gofumpt": true > Test
The VS Code Test UI and editor CodeLens elements allow users to easily run tests, benchmarks, profiles for a given function, file, package, or workspace.
Alternatively, the same functionality is available through a set of commands:
There are many test-related commands that you can explore by typing «Go: test» in the Command Palette.
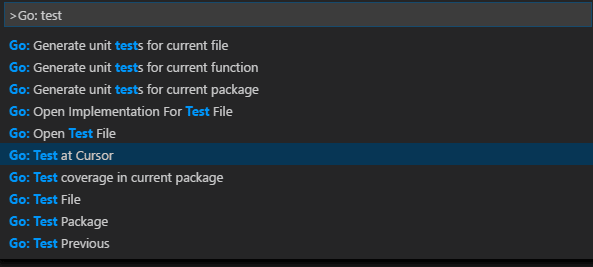
The first three above can be used to generate test skeletons for the functions in the current package, file, or at the cursor using gotests . The last few can be used to run tests in the current package, file, or at the cursor using go test . There is also a command for getting test coverage.
You can configure the extension to run tests and compute test coverage using:
- go.testOnSave
- go.coverOnSave
- go.testFlags
Import packages
The extension organizes imports, and removes unused imports by default. For different behavior, you can override per-language default settings following these instructions.
Run the command Go: Add Import to get a list of packages that can be imported to your Go file. Choose one and it will get added in the import block of your Go file.
Refactoring
Select the area for refactoring (for example variable, function body, etc.). Click on the Code Action light bulb icon that appears in the selected area, or select Refactoring. or Rename Symbol ( F2 ) from the VS Code context menu.
Debugging
The Go extension lets you debug Go code by utilizing the Delve debugger.
Read Debug Go programs in VS Code for setup steps, supported features, configurations, information on remote debugging and a troubleshooting guide. For general debugging features such as inspecting variables, setting breakpoints, and other activities that aren’t language-dependent, review VS Code debugging.
Some features unique to Go are:
- Local & remote debugging
- Data inspection using Delve’s expression syntax
- Dynamic configuration change and inspection options with dlv command from DEBUG CONSOLE
- Ability to hide/show system goroutines (use hideSystemGoroutines configuration)
- Disassembly view support (right-click your source code and select Open Disassembly View)
- Experimental function call, core inspection, Mozilla rr support
Next steps
This has been a brief overview showing the Go extension features within VS Code. For more information, see the details provided in the Go extension README.
To stay up to date on the latest features/bug fixes for the Go extension, see the CHANGELOG.
If you have any issues or feature requests, feel free to log them in the Go extension vscode-go repo.
If you’d like to learn more about VS Code, try these topics:
- Basic Editing — A quick introduction to the basics of the VS Code editor.
- Install an Extension — Learn about other extensions are available in the Marketplace.
- Code Navigation — Move quickly through your source code.
Настройка дебагера Go в Visual Studio Code
Установил Visual Studio Code, поставил extention для языка Go. Написал hello world. При нажатии на шестеренку дебага всплывает сообщение:
Please first open a folder in order to do advanced debug configuration.
Объясните что я упустил? Не понимаю о какой папке идет речь. В Go новичок.
Отслеживать
задан 14 мар 2019 в 12:54
Никола Кривошея Никола Кривошея
1,497 4 4 золотых знака 34 34 серебряных знака 71 71 бронзовый знак
1 ответ 1
Сортировка: Сброс на вариант по умолчанию
как Оказалось ларчик просто открывался. В панели слева есть синяя кнопка которая строит дерево в домашнем каталоге Go, нужно было ее нажать
Отслеживать
ответ дан 14 мар 2019 в 13:04
Никола Кривошея Никола Кривошея
1,497 4 4 золотых знака 34 34 серебряных знака 71 71 бронзовый знак
- windows
- golang
-
Важное на Мете
Похожие
Подписаться на ленту
Лента вопроса
Для подписки на ленту скопируйте и вставьте эту ссылку в вашу программу для чтения RSS.
Дизайн сайта / логотип © 2023 Stack Exchange Inc; пользовательские материалы лицензированы в соответствии с CC BY-SA . rev 2023.11.15.1019
Нажимая «Принять все файлы cookie» вы соглашаетесь, что Stack Exchange может хранить файлы cookie на вашем устройстве и раскрывать информацию в соответствии с нашей Политикой в отношении файлов cookie.
Golang Debugging in Visual Studio Code
Debugging is an indispensable skill for every software engineer, regardless of their experience level. Whether you’re a seasoned developer or just starting your journey with Golang, understanding how to effectively debug Golang code using Visual Studio Code (VSCode) can greatly improve your productivity and proficiency.
In this blog ✍️, we will walk through the process of setting up and using the Golang debugging in VSCode.
Overview
The Go extension allows you to launch or attach to Go programs for debugging. You can inspect variables and stacks, set breakpoints, and do other debugging activities using VS Code’s Debugging UI. These debugging features are possible by using Delve, the Go debugger.
Read Debug Go programs in VS Code for setup steps, supported features, configurations, information on remote debugging and a troubleshooting guide. For general debugging features such as inspecting variables, setting breakpoints, and other activities that aren’t language-dependent, review VS Code debugging.
Setting Up Golang Debugging in VSCode ����
In this hands-on section, we will walk you through the step-by-step process of setting up Golang debugging in Visual Studio Code. By the end of this section, you’ll have a fully configured debugging environment, ready to help you identify and fix bugs in your Golang code.
Step 1: Set Up a Golang Project
Before we start debugging, we need a Golang project to work with. You can either create a new Golang project or use an existing one. For simplicity, let’s create a new Golang project. Open a terminal or command prompt, and create a new directory for your project:
mkdir my_golang_project cd my_golang_project go mod init example.com/my_golang_project Enter fullscreen mode
Exit fullscreen mode
Step 2: Configure the Debug Environment
Now that we have the Go extension installed and a Golang project ready, we need to set up the debugging configuration. In the root directory of your Golang project, create a .vscode folder if it doesn’t exist, and within it, create a launch.json file. This file will define the debugging configurations for your project.
To create a configuration file:
- In the the Run view, click » create a launch.json file «
- Choose Go: Launch Package from the debug configuration drop-down menu. VS Code will create a launch.json file in a .vscode folder in your workspace (project root folder) or in your user settings or workspace settings.
// .vscode/launch.json "version": "0.2.0", "configurations": [ "name": "Launch API", "type": "go", "request": "launch", "mode": "auto", "program": "$", "args": [] > ] > Enter fullscreen mode
Exit fullscreen mode
Step 3: Set a Breakpoint and Start Debugging
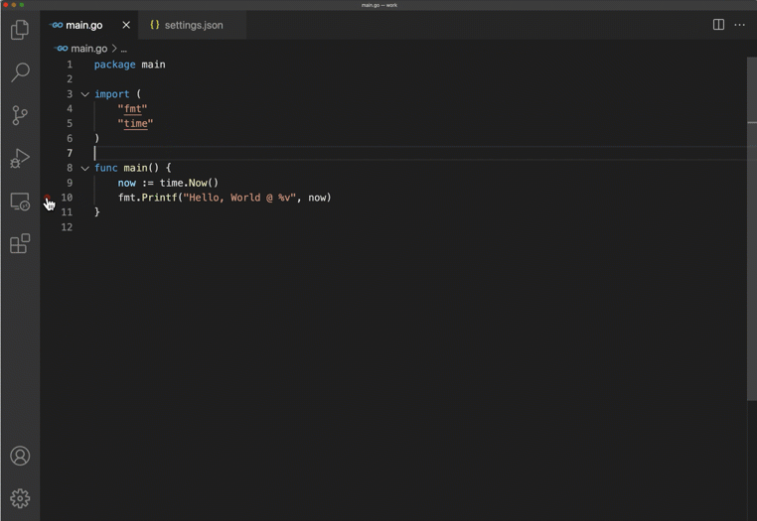
Open a Golang source file in your project (e.g., main.go ) and set a breakpoint on the line where you want to pause the program’s execution. You can set a breakpoint by clicking in the gutter to the left of the line number.
Step 4: Start Debugging
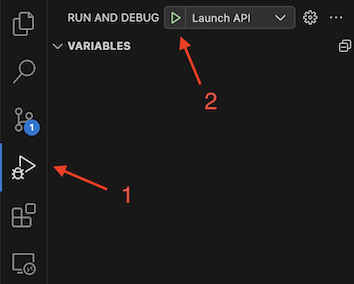
Now, click on the «Run and Debug» icon in the Activity Bar on the side of the window. It looks like a play button with a bug. In the Run and Debug view that appears, select «Go: Launch» from the drop-down menu, and click on the green start button (or press F5) to begin debugging.
❗❗ When you start debugging for the first time or if the dlv executable on your system is too old to support DAP, the Go extension may ask to install or update Delve. Follow the instructions to install it, and then start the debugging session again.
Step 5: Debugging in Action
The program execution will pause at the breakpoint you set. You can now examine variable values, step through the code, and understand the program’s flow during runtime. Utilize the debug toolbar and context menu to interact with the debugger and gain insights into your code.

The available commands are:
- Continue / Pause F5
- Step Over (aka next in Delve) F10
- Step Into (aka step in Delve) F11
- Step Out (aka stepout in Delve) Shift+F11 or ⇧F11
- Restart (currently this is «Stop + Start») Ctrl+Shift+F5 or ⇧⌘F5
- Stop (terminate the debugee. Available in Launch request) Shift+F5 or ⇧F5
�� Congratulations! You have successfully set up Golang debugging in Visual Studio Code and completed your first debugging session. Keep practicing and exploring the various debugging features available to become a proficient Golang debugger. Happy debugging! ��